Accomplishments in FY04

1. Proposed activities in FY04

  • Continue band study for the ABI.
  • Continue to do HES trade-off studies.
  • Investigate the improved and new products from ABI and study the utility of those products on weather monitoring and forecasting.
  • Synergistic use of ABI/HES for better sounding and cloud retrieval.
  • Continue trace gas (ozone, SO2, CO etc.) retrieval from ABI/HES synergism.
  • Continue non-sounding (surface emissivity, land surface temperature etc.) retrieval from ABI/HES synergism.
  • HES sub-pixel cloud detection and characterization using ABI data.
  • Support graduate and undergraduate students.

2. Accomplishments and findings in FY04

2.1 ABI band simulation from current satellite data

ABI band studies include the band selection, the spectral coverage and the merit of each spectral band in the weather and environmental applications. 16 bands covering visible (0.47 and 0.64 mm), near IR (0.86, 1.38, 1.61, 2.26 mm) and IR (3.9, 6.19, 6.95, 7.34, 8.5, 9.61, 10.35, 11.2, 12.3 and 13.3 mm) spectral regions have been selected for ABI (http://cimss.ssec.wisc.edu/goes/abi). ABI bands have been simulated using existing high spectral resolution AVIRIS, AIRS, NAST-I, high spatial resolution MODIS, and high temporal resolution MSG data to demonstrate the spectral and spatial characteristics and also provide simultaneous data set of all ABI spectral bands for algorithm testing and development. Figure 1 shows a simulated "16 band" ABI multiple panel image from April 11, 2004 at approximately 13 UTC. This image over France is built from measurements from three separate satellite instruments (MODIS, MET-8 and AIRS).

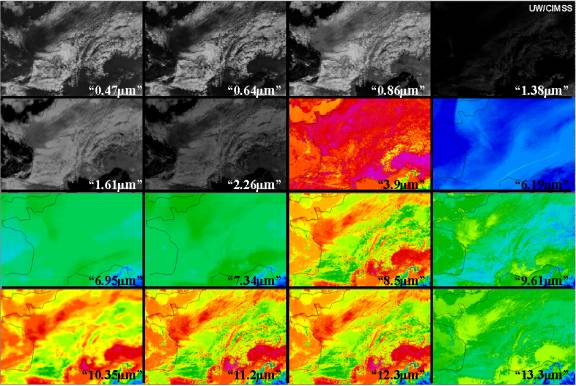
Figure 1. A simulated "16 band" ABI multiple panel image from April 11, 2004 at approximately 13 UTC.

2.2 ABI band study for SO2 detection

An upper level Sulfur Dioxide (SO2) plume from a volcanic eruption has been investigated. The ABI volcanic ash detection will depend on 12 mm data (Schmit et al. 2001), plus 7.34 and 8.5 mm data. The ABI water vapor bands have been shifted to detect upper-level SO2, as well as the mid-level water vapor. Forward calculations with the LBLRTM (left panel, Figure 2) show the sensitivity of the 7.34 and 8.5 mm bands to SO2 for the U.S. standard atmosphere. If the vertical and spatial extents of the plume are sufficient, the ABI should be able to detect medium to large SO2 amounts (greater than 100 Dobson Units (DU)), but not small amounts (less than 50 DU). HES, if they include the 7 mm region, should have more sensitivity than broadband radiometers for detecting SO2 because individual absorption features can be used. ABI bands, simulated from AIRS data, show the potential for depicting upper-level SO2 (right panel, Figure 2). This case is from July 13, 2003 for the eruption of the Soufriere Hills volcano on the island of Montserrat in the eastern Caribbean, images from AIRS data were created to simulate the two ABI bands (13.3 mm and 7.34 mm bands). The resulting BT difference (between 13.3 mm and 7.34 mm) image shows the SO2 plume. This plume agrees well with the Total Ozone Mapping System (TOMS) SO2 observation. Considering the high spatial resolution of ABI, delineation of upper level SO2 is promising.

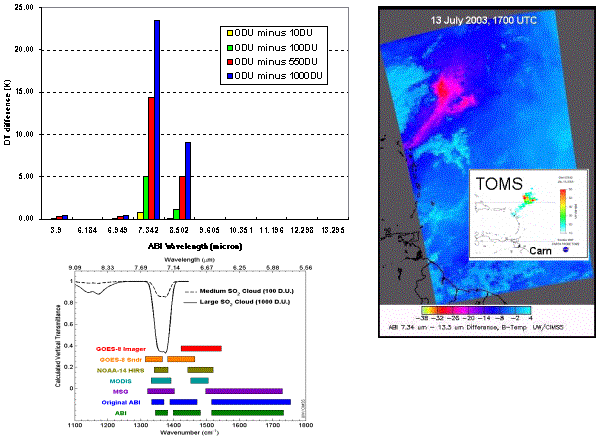
Figure 2. The SO2 detection from the BT difference between AIRS 13.3 mm and 7.34 mm channels, as well as the Total Ozone Mapping System (TOMS) SO2 observation.

2.3 ABI band elimination study for cloud masking

The objective is to study the impact of without some ABI spectral bands

  1. The 2.26 um channel,
  2. The 2.26 and 9.61 um channels,
  3. The 2.26, 9.61, and 7.4 um channels,
  4. The 2.26, 9.61, 7.4, and 0.47 um channels.

The impacts on various products are studied. Especially, the impact of the ABI band elimination on the cloud detection and masking is studied. Due to the unique information provided by each of the four ABI spectral bands that are being studied for elimination, along with the effects on a host of products, none of these bands should be removed from the ABI.

Figure 3 shows the classification masks with all ABI spectral bands (left panel) and without 2.26, 7.4 and 0.47 µm spectral bands (with only 13 ABI bands) (right panel). The circle area has low clouds with all ABI bands. However it is classified as clear with scattered low clouds when the 2.26, 7.4 and 0.47 µm are excluded. MODIS data (MOD021KM.A2002179.1640.004.2003208221115.hdf ) are used in the study.

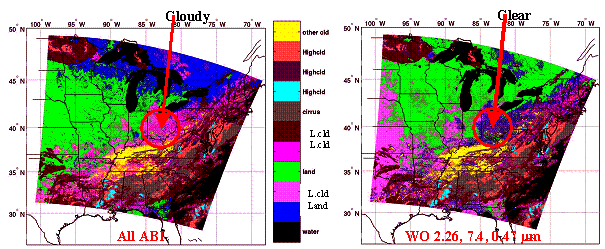
Figure 3. The classification masks with all ABI spectral bands (left panel) and without 2.26, 7.4 and 0.47 µm spectral bands (with only 13 ABI bands) (right panel).

2.4 ABI 3.7 µm versus 3.9 µm studies

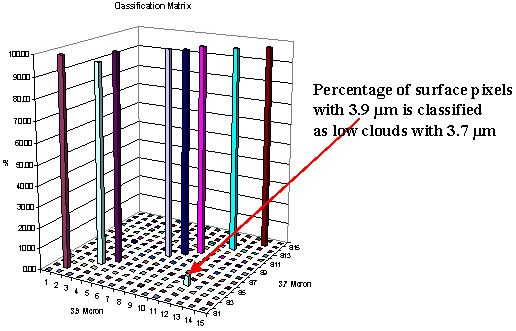
Figure 4. Classification difference matrix from using 3.9 µm + other ABI bands to using 3.7 µm + other bands.

A trade-off study has been done to compare the 3.7 mm and 3.9 mm for ABI shortwave IR band that is very important for the cloud and fire detection. Both temperature and moisture sensitivities of 3.7 mm and 3.9 mm are analyzed. MODIS multi-spectral band data have been used to investigate the surface and cloud type classification difference between using 3.7 mm and 3.9 mm, results show that (1) 3.7 mm and 3.9 mm have the similar temperature and moisture information; (2) 3.7 mm and 3.9 mm have slight differences in day time cloud detection/classification due to the different solar reflectance, while they are almost identical in night time cloud detection/classification; (3) 3.7 µm should be better in cloud detection than the 3.9 µm during daytime, while 3.9 µm should be better than the 3.7 µm on fire detection. Figure 4 shows the classification difference matrix from using 3.9 µm + other ABI bands to using 3.7 µm + other bands. Of-diagonal means the percentage of pixels assigned to a class with 3.9 µm + other ABI bands, now assigned differently to the other class with 3.7 µm + other ABI bands. 3.7 mm detects more low clouds than 3.9 mm in this case. Daytime MODIS data are used.

2.5 ABI temporal resolution study

The objective is to continue ABI temporal resolution study, and to answer the question on what the ABI temporal resolution we need. Studies include:

  1. Images are simulated for ABI using "morphing" algorithms on existing GOES satellite imagery, and the impact of increased spatial and temporal resolution is evaluated. "Morphing" is a term that describes a broad category of digital image algorithms used to create smooth, seamless transitions between two or more images. In satellite imagery, morphing can be used to simulate image sequences at a temporal resolution that is higher than the original instrument capabilities. This makes morphing a useful tool for visualizing the five-minute full disk updates planned for the ABI bands from the current 25-minute full disk images.
  2. MM5 cube data with 5-minutes time step during the International H2O Project (IHOP) experiment were used to simulate the ABI IR images. A fast cloudy radiative transfer model that accounts for cloud effects (scattering and absorption) was used in simulating the ABI cloud radiances. 5-minute loops reveal more temporal features on storm and convective system development than the 30-minute loops.

Studies show that 5-minute ABI observations are very important to delineate the detailed features and structures of significant weather systems such as storm and convective systems. Movies on ABI temporal resolution study have been included separately in the attached CD.

2.6 Continue trade-off study for HES (spectral coverage, spectral resolution, spatial resolution, signal-to-noise etc.)

The objective is to find optimal balance among spectral coverage, spectral resolution, spatial resolution, signal-to-noise, etc. based on the users' requirement and technical requirement, and to establish a linkage between the science requirement and instrument requirement. Accomplishments and findings include

  1. NASTI retrievals at 2km spatial resolution are used to demonstrate the requirement of HES spatial resolution.
  2. Vertical resolution analysis is created for HES trade-off studies. Trade-off studies have been done on spectral coverage, spectral resolution and spatial resolution, trade-off studies are continued with focus on the vertical resolution of atmospheric temperature, moisture and ozone profile retrieval from HES. Algorithm has been developed to analyze the vertical resolution from various spectral resolutions, options of spectral coverage, and different signal-to-noise ratios for HES. Trade-off studies on HES signal-to-noise are conducted with vertical resolution analysis in this year. The signal-to-noise is crucial to achieve the high vertical resolution according the study. Vertical resolution study will continue.
  3. Longer midwave (LMW) versus shorter midwave (SMW) on temperature and moisture retrieval is re-evaluated using the updated NeDT from PORD. Either LW+LMW or LW+SMW is fine for HES temperature and moisture retrievals; LW+LMW is slightly better than LW+SMW in terms of temperature and moisture retrievals based on the PORD NeDT. Ideally, LW+LMW+SMW is the best option in terms of temperature, moisture, ozone and other trace gas (e.g., CH4, SO2, and CO) information.

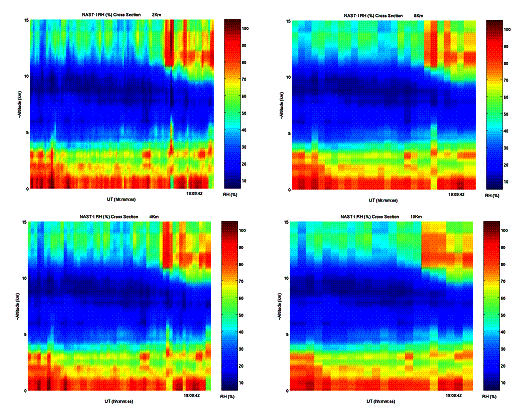
Figure 5. NAST-I Relative Humidity (RH) (%) crosses section at 2 km spatial resolution (upper left panel), 4km resolution (lower left panel), 8km resolution (upper right panel), and 10 km resolution (lower right panel). The date is 26 July 2002 over the ocean near Florida.

Figure 5 show the NASTI water vapor retrieval cross-section with various spatial resolutions; higher spatial resolution is needed for depicting the moisture spatial gradients.

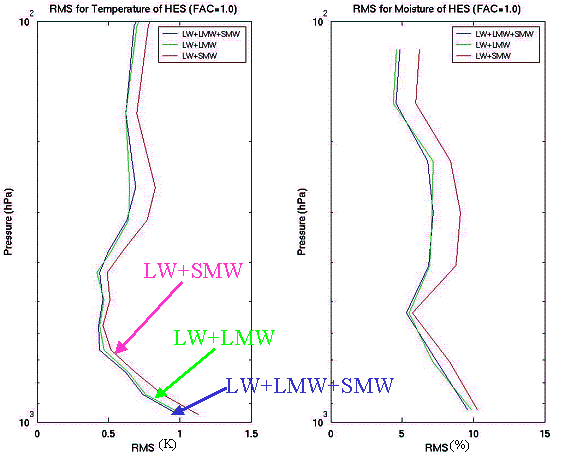
Figure 6. The temperature (left panel) and water vapor relative humidity (RH) (right panel) retrieval rmse from HES LW + LMW, LW + SMW, and LW +LMW+ SMW.

Figure 6 shows the temperature (left panel) and water vapor relative humidity (RH) retrieval root mean square error (rmse) from simulated HES radiances for the following configurations: LW + LMW, LW + SMW, and LW +LMW+ SMW. (LW: 650 - 1200 cm-1; LMW: 1200 - 1650 cm-1; SMW: 1650 - 2250 cm-1). 650 global independent retrievals are included in the statistics. Both LMW and SMW are recommended for HES spectral coverage.

Spectral resolution and signal-to-noise ratio also determines the vertical resolution of temperature and moisture soundings. Higher spectral resolution and better signal-to-noise ratio correspond to higher vertical resolution. Figure 7 shows the temperature vertical resolutions from HES two-band option (LW+SMW) with reduced noise, nominal noise and double noise, respectively. A reduced noise significantly improves the vertical resolution of temperature retrieval. The vertical resolution study will continue on spectral resolution, spectral coverage, etc.

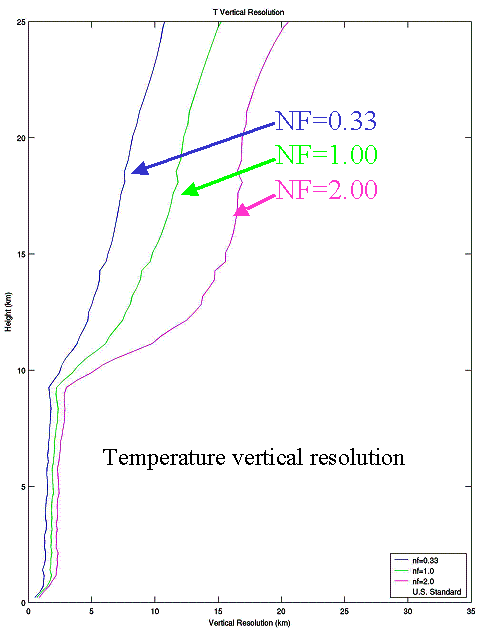
Figure 7. The temperature vertical resolutions from HES two-band option (LW+SMW) with reduced noise, nominal noise and double noise, respectively.

2.7 HES/current GOES Sounder simulation study using MM5

The objective is to create continuous cube data of atmospheric field for ABI/HES simulation study, especially to demonstrate the capability of high spectral and temporal resolution ABI/HES system over the current GOES imager/sounder system on monitoring the weather evolution. Accomplishments and findings include:

Fine spatial resolution (2 - 4 km spatial resolution) cube data from regional model MM5 has been created for HES and current GOES sounder radiance simulation for both clear and cloudy skies during IHOP. The time step for the successive cube data is 30 minutes. Forward and inverse models are created to simulate the radiances and retrievals for HES and current GOES sounder.

  1. Simulation shows HES keeps the temporal and spatial features and gradients much better than the current GOES Sounder.
  2. With high spectral resolution, HES is able to obtain soundings under some partly thin cloudy skies, while the current GOES sounder with 18 spectral channels can only obtain soundings under clear skies only.

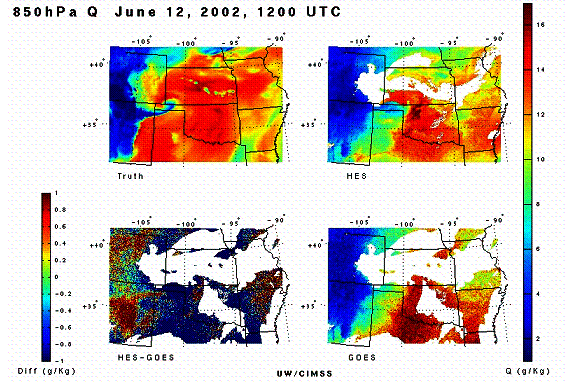
Figure 8. 850 hPa true water vapor (upper left), retrievals from HES (upper right), retrievals from the current GOES sounder (lower right), and the differences between HES retrievals and the current GOES sounder retrievals (lower left).

Figure 8 shows the 850 hPa true water vapor mixing ratio from MM5 used to simulate HES and current GOES sounder radiances (upper left), water vapor retrievals from simulated HES radiances (upper right), water vapor retrievals from simulated current GOES sounder radiances (lower right), along with the differences between HES retrievals and the current GOES sounder retrievals (lower left panel). This is single time step retrieval from HES and GOES simulated radiances, HES is closer to the truth than current GOES Sounder in term of accuracy as well as spatial features. Movies on HES and current GOES Sounder simulations from have been included separately in the attached CD.

2.8 ABI/HES synergism studies

The objective is to investigate the better use of data from ABI/HES system, algorithms for products by synergistically using the ABI and HES are developed. MODIS/AIRS on EOS Aqua are used in the study. Accomplishments and findings include:

  1. HES sub-pixel cloud characterization using ABI mask products has been studied, MODIS/AIRS data are used. Collocated MODIS mask products (cloud mask, cloud phase mask, and cloud classification mask) with 1km are very useful for AIRS because
    • collocated MODIS cloud mask tells if an AIRS footprint is clear or cloudy.
    • collocated MODIS cloud phase mask tells if an AIRS footprint is water cloud, ice clouds, or mixed phase clouds.
    • collocated MODIS cloud classification mask tells if an AIRS footprint is partly clouds or overcast clouds, and if it is single-layer clouds or multi-layer clouds.
  2. MODIS/AIRS are synergistically used for cloud property retrieval.
    • MODIS cloud mask will be used to generate AIRS cloud mask.
    • MODIS cloud mask will be used to generate AIRS phase mask.
    • As an option, MODIS cloud products can serve as the background and first guess information in variational retrieval of cloud properties from AIRS cloudy radiances.

The advantage of ABI/HES synergism is also studied using MODIS and AIRS data, for example, ABI can help HES in (1) cloud detection, (2) sub-pixel cloud characterization by identifying the cloud phase mask and cloud classification mask, (3) cloud-clearing for partly HES cloudy footprints, (4) improving the retrieval by providing the background and first guess information in the variational approach. Results show that cloud property retrievals from the combination of imager/sounder (ABI/HES) are better than those from either imager (ABI) alone or sounder (HES) alone (Li et al. 2004b). Figure 9 shows an AIRS window image of September 06, 2002 (upper left panel), the 1km MODIS classification mask superimposed to a study area (indicated in upper left panel) for the AIRS sub-pixel cloud characterization (upper right panel), and spectra of AIRS Brightness Temperature (BT) observation (black line), BT calculations with cloud-top pressure (CTP) and effective cloud amount (ECA) from MODIS (green line), CTP and ECA from MODIS+AIRS (blue line), CTP, cloud particle size (CPS) in diameter cloud optical thickness (COT) at 0.55 mm from MODIS+AIRS (red line), respectively in the lower panel, for the indicated AIRS cloudy footprint. Single-layer and mid-level clouds are found by MODIS 1km classification mask over Lake Michigan. They are also ice clouds identified by the 1km MODIS cloud phase mask. Calculation with CTP, CPS and COT from combined MODIS and AIRS fits better the observation for the cloud footprint.

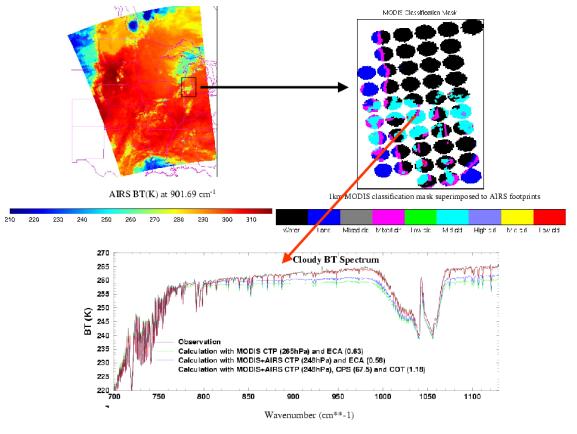
Figure 9. AIRS sub-pixel cloud characterization using the MODIS 1km classification mask superimposed to the AIRS footprints. The advantage of synergistic use of MODIS and AIRS in cloud property retrieval is also indicated in the lower panel.

3. Peer-reviewed Journal Papers on ABI/HES studies in FY04

  • Li, J., W. P. Menzel, Z. Yang, R. A. Frey, and S. A. Ackerman, 2003: High spatial resolution surface and cloud type classification from MODIS multi-spectral band measurements, J. Appl. Meteorol., 42, 204 - 226.
  • Li, J., W. Paul Menzel, Fengying Sun, T. J. Schmit, and James Gurka, 2004a: AIRS sub- pixel cloud characterization using collocated high spatial resolution MODIS data, Journal of Appl. Meteorol. 43, 1083 - 1094.
  • Li, J., W. P. Menzel, W. Zhang, F. Sun, T. J. Schmit, J. Gurka, and E. Weisz, 2004b: Synergistic use of MODIS and AIRS in a variational retrieval of cloud parameters, J. Appl. Meteorol, (in press)
  • Li, J., H.-L. Huang, C.-Y. Liu, P. Yang, T. J. Schmit, H. Wei, W. Paul Menzel, E. Weisz, and L. Guan, 2004c: Retrieval of cloud microphysical properties from MODIS and AIRS. J. Appl. Meteorol. (submitted)
  • Huang, H.-L., W. L. Smith, J. Li, et al., 2004: Minimum Local Emissivity Variance Retrieval of Cloud Altitude and Emissivity Spectrum - Simulation and Initial Verification, J. Appl. Meteorol. 43, 795 - 809.
  • Schmit, T. J., Mathew M. Gunshor, W. Paul Menzel, James J. Gurka, J. Li, and Scott Bachmeier, 2004: Introducing the Next-generation Advanced Baseline Imager (ABI) on Geostationary Operational Environmental Satellites (GOES)-R, Bull. Amer. Meteorol. Soc. (submitted)
  • Wei, H., P. Yang, J. Li, B. A. Baum, H. L. Huang, S. Platnick, and Y. X. Hu, 2004: Retrieval of Semitransparent Ice Cloud Optical Thickness from Atmospheric Infrared Sounder (AIRS) measurements, IEEE Trans. on Geosci. and Remote Sensing (in press).
  • Zhou, D. K., W. L. Smith, J. Li, and S. A. Mango, 2004: Tropospheric CO observed with NAST-I: retrieval algorithm and first results, Applied Optics (submitted)

4. Selected Proceeding Papers on ABI/HES studies in FY04

  • Li, Jun; Sun, Fengying; Schmit, Timothy J.; Menzel, W. Paul, and Gurka, James. Study of the Hyperspectral Environmental Suite (HES) on GOES-R. International Conference on Interactive Information and Processing Systems (IIPS) for Meteorology, Oceanography, and Hydrology, 20th, Seattle, WA, 11-15 January 2004 (preprints). Boston, MA, American Meteorological Society, 2004, Paper P2.21.
  • Schmidt, Christopher C.; Li, Jun, and Sun, Fengying. Simulation of and comparison between GIFTS, ABI, and GOES I-M Sounder ozone estimates and applications to HES. International Conference on Interactive Information and Processing Systems (IIPS) for Meteorology, Oceanography, and Hydrology, 20th, Seattle, WA, 11-15 January 2004 (preprints). Boston, MA, American Meteorological Society, 2004, Paper P2.37.
  • Schmit, Timothy J.; Li, Jun; Gunshor, Mathew M.; Schmidt, Christopher C.; Menzel, W. P.; Gurka, James, and Sieglaff, Justin. Study of the Advanced Baseline Images (ABI) on the GOES-R and beyond. International Conference on Interactive Information and Processing Systems (IIPS) for Meteorology, Oceanography, and Hydrology, 20th, Seattle, WA, 11-15 January 2004 (preprints). Boston, MA, American Meteorological Society, 2004, Paper 14.2.
  • Sun, Fengying; Li, Jun; Schmit, Timothy J., and Posselt, Derek. HES simulation study using cube data from MM5. International Conference on Interactive Information and Processing Systems (IIPS) for Meteorology, Oceanography, and Hydrology, 20th, Seattle, WA, 11-15 January 2004 (preprints). Boston, MA, American Meteorological Society, 2004, Paper P1.37.
  • Schmit, J. Timothy, J. J. Gurka, W. P. Menzel, and M. M. Gunshor. Introducing the next generation geostationary imager - GOES-R's Advanced Baseline Imager (ABI). 13th Conference on Satellite Meteorology, Norfolk, VA, 20 - 23 September 2004 (preprints). P1.6.
  • Li, Jun, Timothy J. Schmit, Chian-Yi Liu, W. P. Menzel, and Gurka, James. Studies on the Hyperspectral Environmental Suite (HES) on GOES-R. 13th Conference on Satellite Meteorology, Norfolk, VA, 20 - 23 September 2004 (preprints). P1.11.
  • Liu, Chian-Yi, J. Li, and Timothy J. Schmit. The Hyperspectral Environmental Suite (HES) simulation study using MM5 data. 13th Conference on Satellite Meteorology, Norfolk, VA, 20 - 23 September 2004 (preprints). P1.12.

5. Select presentations on ABI/HES studies in FY04

  • Jun Li attended AGU Fall Meeting in San Francisco, CA from Dec. 08 - 12, 2003, and gave a presentation on cloud property retrieval advanced imager and sounder.
  • Jun Li attended IRS2004 held in Busan, Korea from Aug. 23 -28, 2004, and gave a presentation on synergistic use of advanced imager and sounder.
  • Jun Li attended 13th satellite meteorology and oceanography held in Norfolk, VA, from Sept. 20 - 23, 2004, and gave an invited talk on cloud property retrieval from advanced imager and sounder data.
  • Jun Li visited National Satellite Meteorological Center of China on Feb.20, 2004, and gave a seminar on ABI on GOES-R and beyond.
  • Timothy J. Schmit attended the GUC-III, May 10 - 13, Bloomfield, CO, gave 3 presentations at the GOES-R Users Conference (ABI, data distr. and a poster summary).
  • Timothy J. Schmit organized the 4th NOAA hyperspectral workshop 17 - 19 August 2004 at Madison, WI, gave talks on "HES/ABI synergism" and "NOAA needs on hyper-spectral imaging and sounding".
  • Timothy J. Schmit talked on GOES-R HES Requirements at the 4th Workshop on Hyperspectral Science of UW-Madison MURI, GIFTS, and GOES-R.
  • Timothy J. Schmit gave a presentation entitled "Using VISITviewTM for Collaboration and Distance Learning" at the October NOAA Tech 2004 conference in Silver Spring, MD. Timothy J. Schmit gave a talk on STUDY OF THE ADVANCED BASELINE IMAGER (ABI) ON THE GOES-R AND BEYOND at the IIPS conference in SEA, Washington in January.- GOES-R ABI Seminar given at the NOAA Science Center.
  • Timothy J. Schmit gave a seminar at the National Oceanic and Atmospheric Administration (NOAA) Science Center on February 17. The title was "The next generation imager on Geostationary Operational Environmental Satellite (GOES)-R".
  • Timothy J. Schmit and James J. Gurka (NOAA/NESDIS Office of Systems Development) spoke at a National Weather Service (NWS) Science and Technology GOES-R Readiness Seminar on February 18 in Silver Spring. The title was "Introducing GOES-R: Ensuring User Readiness for 2012". Informal briefings to OSD on the use of Geostationary Operational Environmental Satellite (GOES) data and products at large satellite view angles, impact of a GOES-R satellite position shift, an overview of data compression work on high-spectral infrared sounder data and some of the uses of GOES-R data in support of National Oceanic and Atmospheric Administration (NOAA)'s mission goals.

6. Acronym list

ABI
Advanced Baseline Imager
AIRS
Atmospheric Infrared Sounder
AVIRIS
Airborne Visible InfraRed Imaging Spectrometer
BT
Brightness Temperature
CIMSS
Cooperative Institute for Meteorological Satellite Studies
COT
Cloud optical thickness
CPS
Cloud particle size
CTP
Cloud-top pressure
ECA
Effective Cloud Amount
FOV
Field-of-View
GIFTS
Geosynchronous Imaging Fourier Transform Spectrometer
GOES
Geostationary Operational Environmental Satellite
GUC
GOES Users' Conference
HES
Hyperspectral Environmental Suite
IHOP
International H2O Project
IR
Infrared
LMW
Longer Middlewave
LW
Longwave
MM5
5th generation Pennsylvania State-NCAR Mesoscale Modeling system
MODIS
Moderate-Resolution Imaging Spectroradiometer
MW
Middlewave
NASTI
NPOES Atmospheric Sounder Testbed-Interferometer
MM5
Mesoscale Model
MURI
Multidisciplinary University Research Initiative
NESDIS
National Environmental Satellite, Data, and Information Service
NOAA
National Oceanic and Atmospheric Administration
ORA
Office of Research and Applications
OSD
Office of System and Development
RMSE
Root Mean Square Error
SSEC
Space Science and Engineering Center
SMW
Shorter Middlewave
SW
Shortwave
TOMS
Total Ozone Mapping System
UW
University of Wisconsin-Madison

Valid HTML 4.01 Transitional