Record May snowfall in Duluth, Minnesota
Several snowfall records have already been broken for the Duluth area. The table in the image shows a list of these records. Stay tuned as the Monthly snowfall total and daily snowfall for today (5/9) are likely to change. #mnwx #mnclimate pic.twitter.com/nYbGyV6kZt
— NWS Duluth (@NWSduluth) May 9, 2019
GOES-16 “Red” Visible (0.64 µm) images, with plots of surface weather type (yellow) and GLM Groups (red) [click to play animation | MP4]
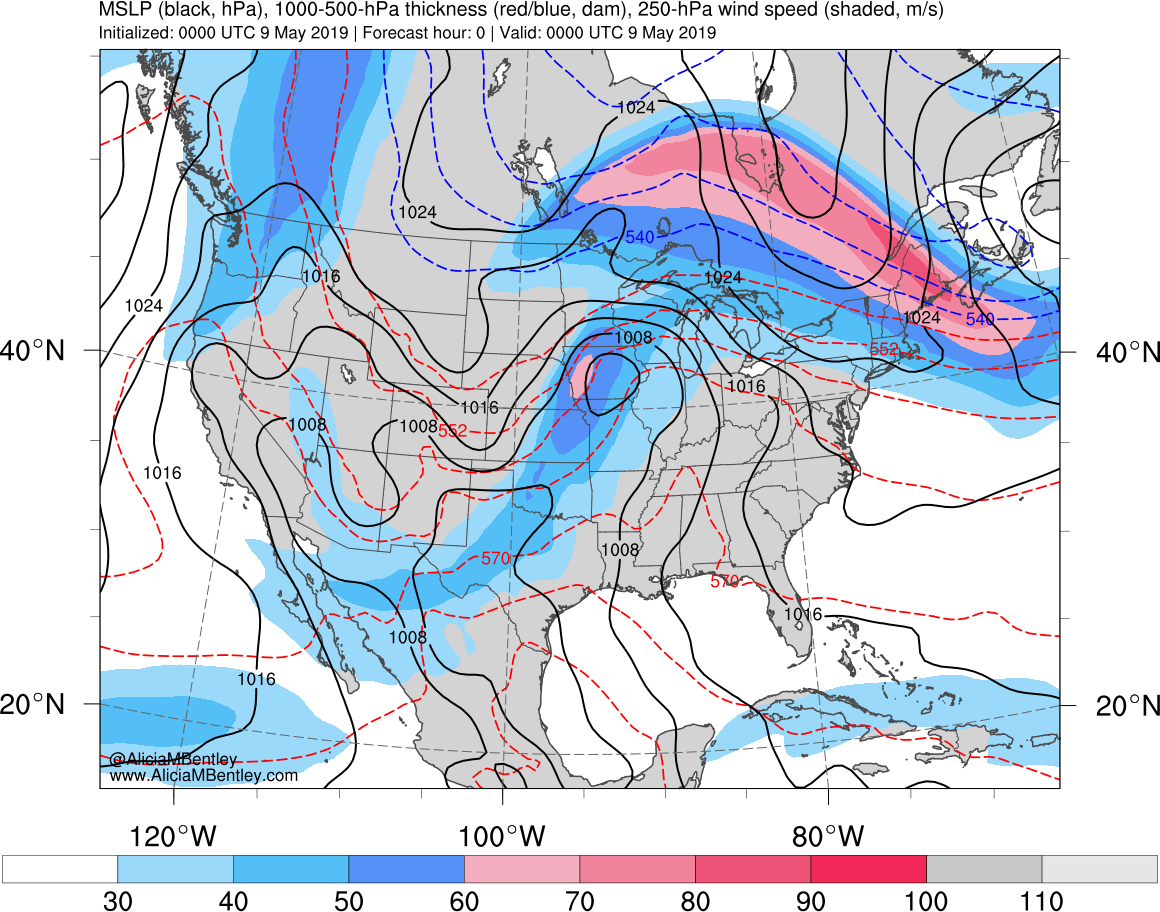
GOES-16 Mid-level Water Vapor (6.9 µm) images (below) showed the formation of a SW-NE oriented deformation zone across Minnesota — forcing for ascent was further aided by a stretched lobe of 500 hPa vorticity and 310 K potential vorticity that moved northeastward across the region during this period, along with a favorably-coupled 250 hPa jet streak configuration. Cloud features within the deformation zone across eastern South Dakota into southern/central Minnesota had an appearance resembling convective elements/bands in both the Visible and Water Vapor imagery.
GOES-16 Mid-level Water Vapor (6.9 µm) images, with plots of surface weather type (yellow) and GLM Groups (red) [click to play animation | MP4]
GOES-16 “Red” Visible (0.64 µm) images, with plots of surface weather type (yellow) and GLM Groups (red) [click to enlarge]
GOES-16 Mid-level Water Vapor (6.9 µm) images, with plots of surface weather type (yellow) and GLM Groups (red) [click to enlarge]
We have received multiple reports of thundersnow in the Duluth and Cloquet areas. We have seen and heard it here at the office as well! #mnwx #wiwx
— NWS Duluth (@NWSduluth) May 8, 2019
Through occasional breaks in the clouds later in the day on 09 May, GOES-16 Day Cloud Phase Distinction Red-Green-Blue (RGB) images (below) revealed the stationary signature of fresh snow cover (darker green) across central to northeastern Minnesota and far northwestern Wisconsin (glaciating cloud tops also appear as shades of green).

GOES-16 Day Cloud Phase Distinction RGB images [click to play animation | MP4]
===== 10 May Update =====
GOES-16 “Red” Visible (0.64 µm) images [click to play animation | MP4]
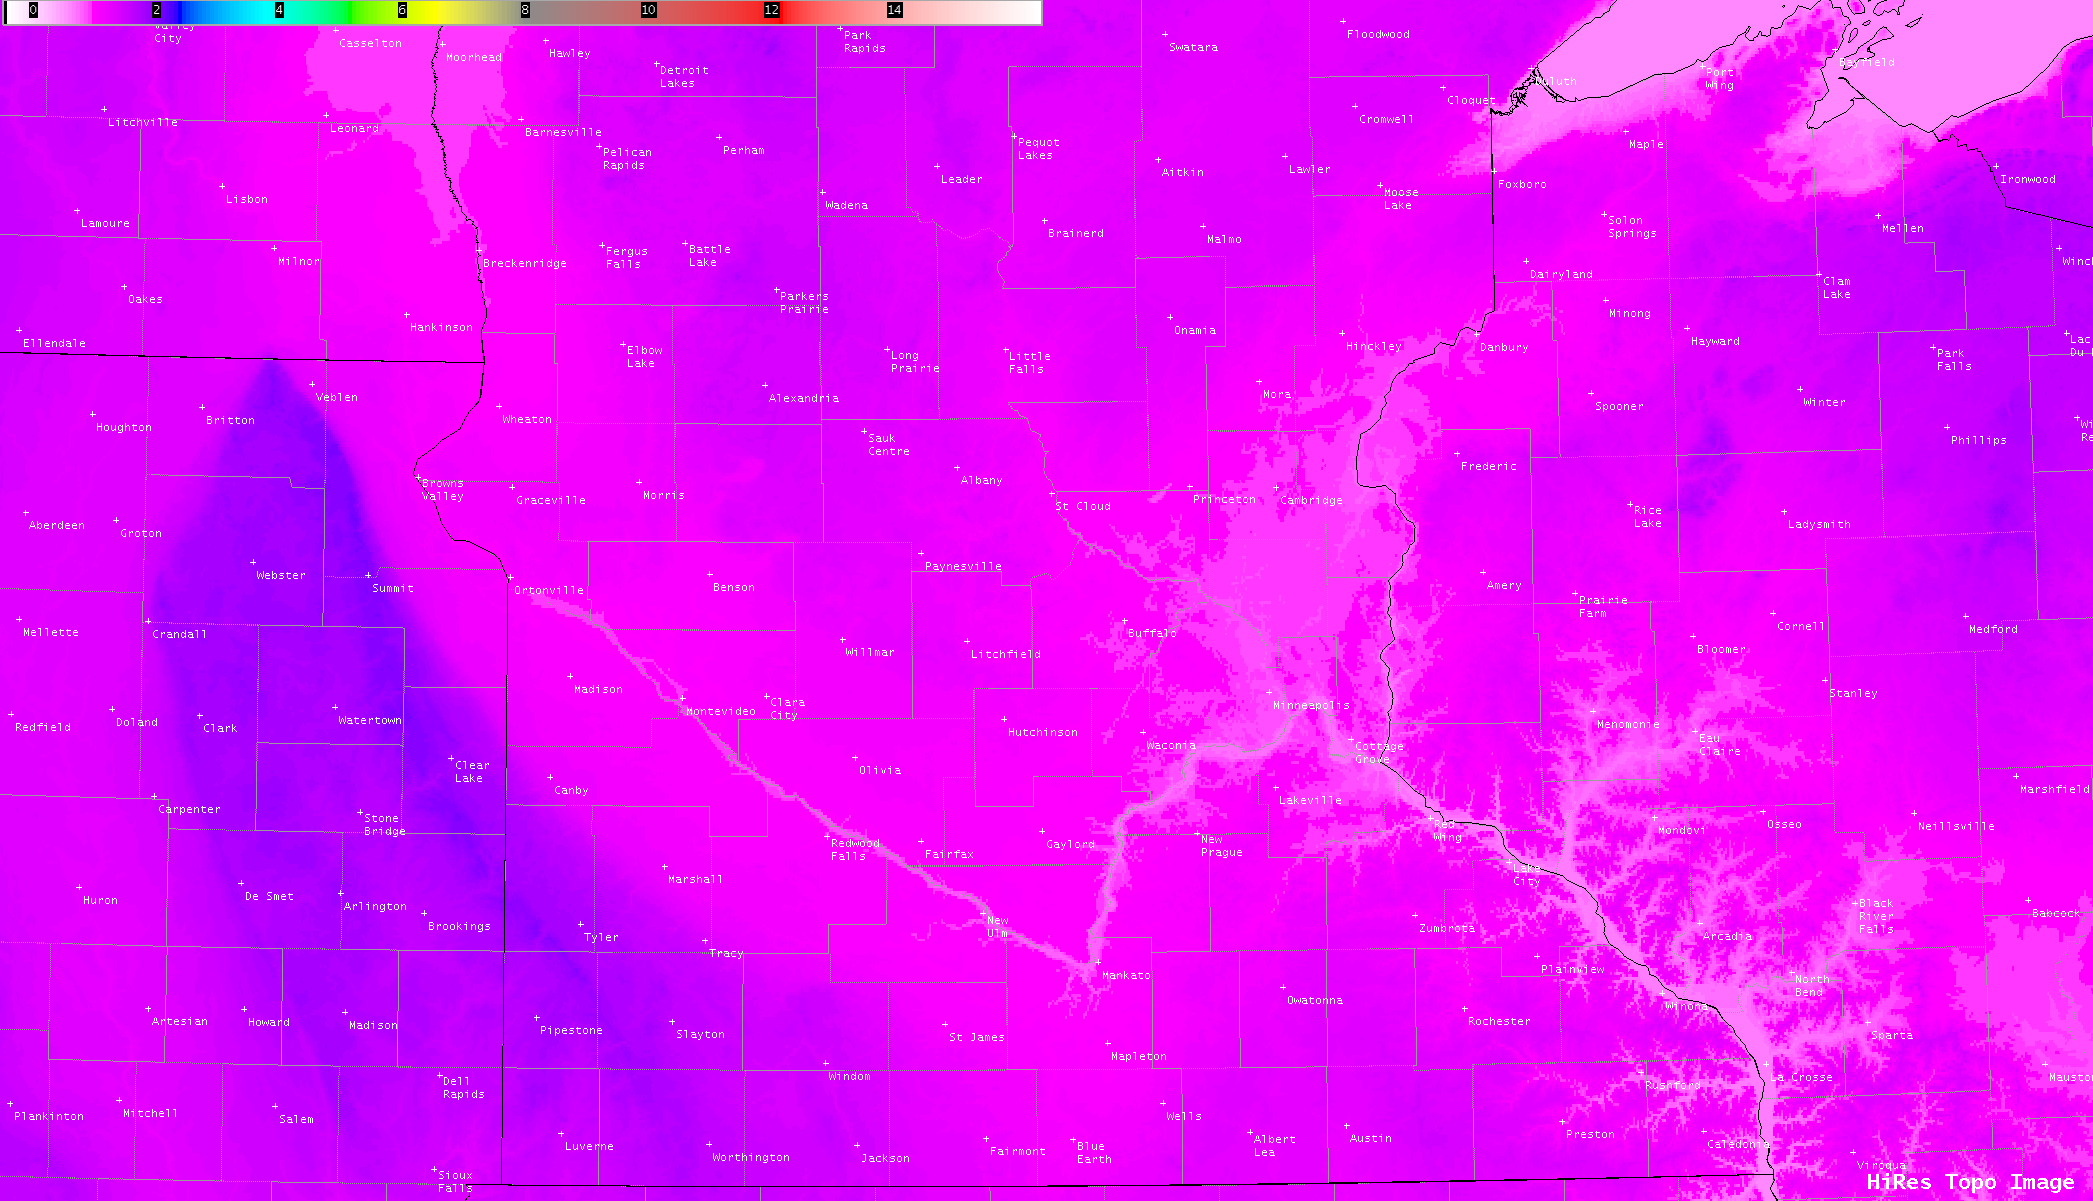
Comparisons of GOES-16 Land Surface Temperature (LST) and Visible images at 1401 UTC and 1501 UTC (below) indicated that LST values were as much as 10ºF colder within the areas of snow cover (brighter shades of cyan) compared to adjacent bare ground.
GOES-16 Land Surface Temperature and “Red” Visible (0.64 µm) images at 1401 UTC [click to enlarge]
GOES-16 Land Surface Temperature and “Red” Visible (0.64 µm) images at 1501 UTC [click to enlarge]