Launch of GOES-S
![GOES-16 “Red” Visible (0.64 µm, top), “Blue” Visible (0.47 µm, middle) and Near-Infrared “Snow/Ice” (1.61 µm, bottom) images, with plots of surface reports [click to play animation]](https://cimss.ssec.wisc.edu/satellite-blog/wp-content/uploads/sites/5/2018/03/180301_goes16_visible_cirrus_GOES_S_launch_anim.gif)
GOES-16 “Red” Visible (0.64 µm, top) and Near-Infrared “Cirrus” (1.37 µm, bottom) images, with plots of 22 UTC surface reports [click to play animation]
Warm thermal anomalies from the Atlas V rocket boosters were also evident on GOES-16 Upper-level (6.2 µm), Mid-level (6.9 µm) and Low-level (7.3 µm) Water Vapor images, moving rapidly eastward (below). The cooler signature of the lower-altitude rocket condensation plume was also evident as it slowly drifted offshore just east of the launch site.
![GOES-16 Upper-level (6.2 µm, top), Mid-level (6.9 µm, middle) and Low-level (7.3 µm, bottom) images [click to play animation]](https://cimss.ssec.wisc.edu/satellite-blog/wp-content/uploads/sites/5/2018/03/180301_goes16_water_vapor_GOES_S_launch_anim.gif)
GOES-16 Upper-level (6.2 µm, top), Mid-level (6.9 µm, middle) and Low-level (7.3 µm, bottom) images [click to play animation]
![GOES-16 Upper-level (6.2 µm, top), Mid-level (6.9 µm, middle) and Shortwave Infrared (3.9 µm, bottom) image [click to enlarge]](https://cimss.ssec.wisc.edu/satellite-blog/wp-content/uploads/sites/5/2018/03/180301_goes16_water_vapor_shortwaveIR_GOES_S_launch_anim.gif)
GOES-16 Upper-level Water Vapor (6.2 µm, top), Mid-level Water Vapor (6.9 µm, middle) and Shortwave Infrared (3.9 µm, bottom) images [click to enlarge]
![Multi-panel images showing all 16 spectral bands of the GOES-16 ABI [click to play animation]](https://cimss.ssec.wisc.edu/satellite-blog/wp-content/uploads/sites/5/2018/03/180301_goes16_16panel_GOES_S_launch_anim.gif)
Multi-panel images showing all 16 spectral bands of the GOES-16 ABI [click to play animation]
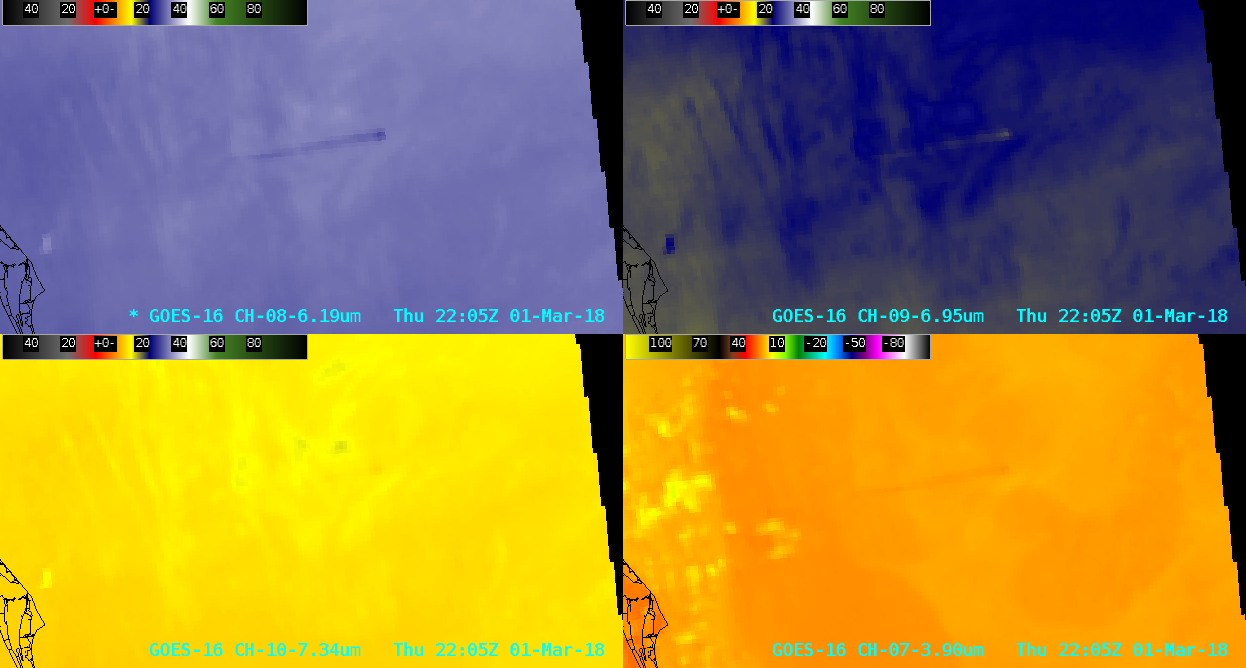
![GOES-16 Upper-level (6.2 µm, top left), Mid-level (6.9 µm, top right), Low-level (7.3 µm, bottom left) and Shortwave Infrared (3.9 µm, bottom right) images [click to enlarge]](https://cimss.ssec.wisc.edu/satellite-blog/wp-content/uploads/sites/5/2018/03/180301_goes16_WaterVapor_SgortwaveInfrared_GOES_S_awips_anim.gif)
GOES-16 Upper-level (6.2 µm, top left), Mid-level (6.9 µm, top right), Low-level (7.3 µm, bottom left) and Shortwave Infrared (3.9 µm, bottom right) images [click to enlarge]
Below is an animation of GOES-16 “Red” Visible (0.64 µm) images from AWIPS, providing another view of the rocket condensation plume.
GOES-16 “Red” Visible images, with plots of 22 UTC surface reports [click to enlarge]