You can use GOES-R Soundings to mitigate the loss of conventional radiosondes
Staffing issues at a number of WFOs has lately meant gaps in the launching of soundings, either at 0000 UTC or at 1200 UTC. Satellite profiles derived from the GFS model and nudged towards ABI observations are available in AWIPS, and these products can fill in some of that missing information. (This training video will show where the products are in the AWIPS menu — scroll forward to 5 mins 25 seconds). The image below shows the Legacy Atmospheric Profile (LAP) display in AWIPS for a single time, with points that will have — every 30 minutes — a vertical profile of temperature and moisture if clouds are not present. (Click here to see an animation that demonstrates how clouds affect the distribution of valid points with clear sky products).
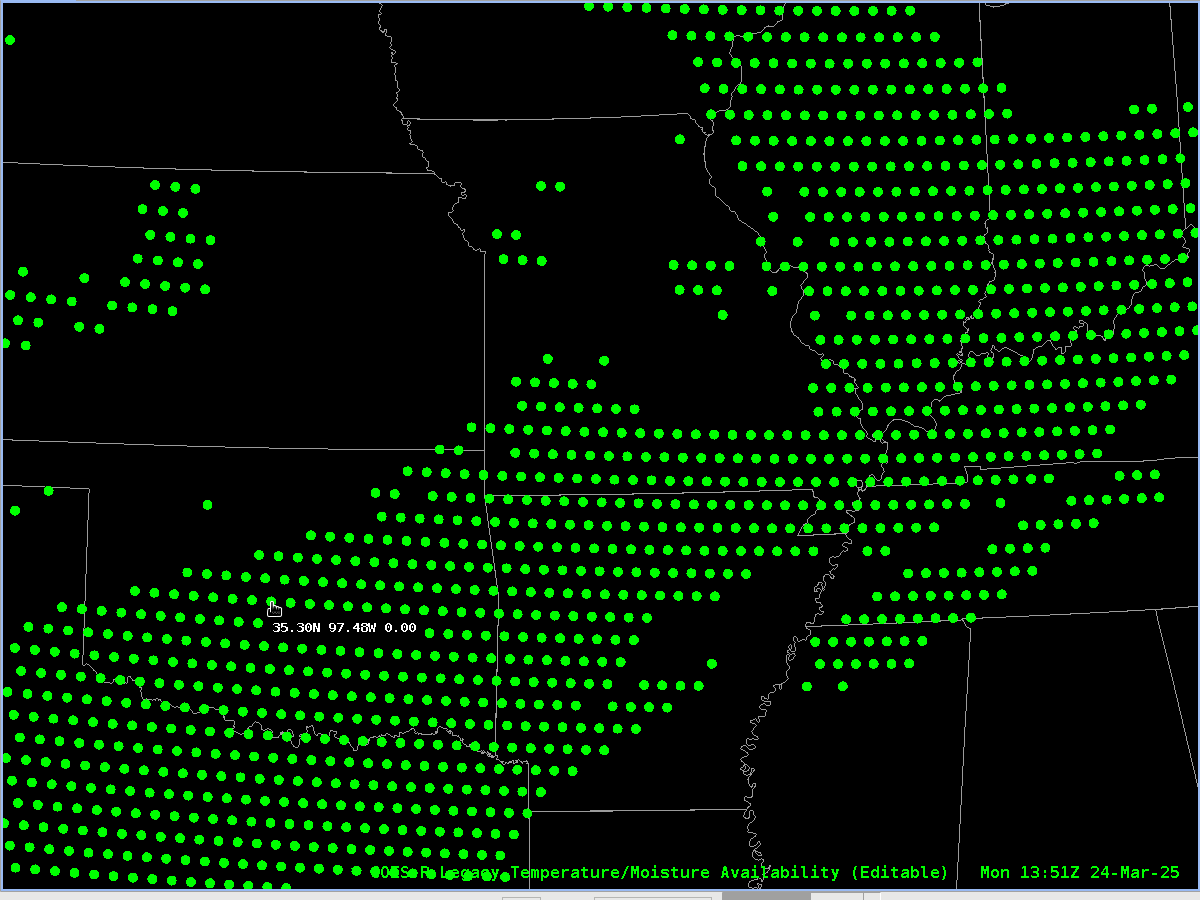
The point highlighted in central Oklahoma is close to a launch site at Norman. The 0000 and 1200 UTC soundings from KOUN are shown below. There is considerable drying aloft between the two times and, of course, low-level cooling.
What do the Legacy Profiles show for this span of time? That’s shown in the animation below. The profiles are much smoother than you observe with radisondes, and thin layers of moisture (or dryness) that could be synoptically important are not well-resolved. However, the profiles capture the overall evolution of the atmosphere. A strength of LAP data is monitoring changes, and the edges of gradients. Those gradients might be a lot easier to view by loading Derived Stability Indices (CAPE, Lifted Index, etc) and Total Precipitable Water fields that are derived from the LAP data. (AWIPS note: I’ve been unable to get pop-up SkewTs to work with LAP data. Maybe that’s just my AWIPS however).

The following two toggles directly compare the 0000 UTC and 1200 UTC KOUN soundings with the closest-in-time profiles. There are similarities between the two profiles.


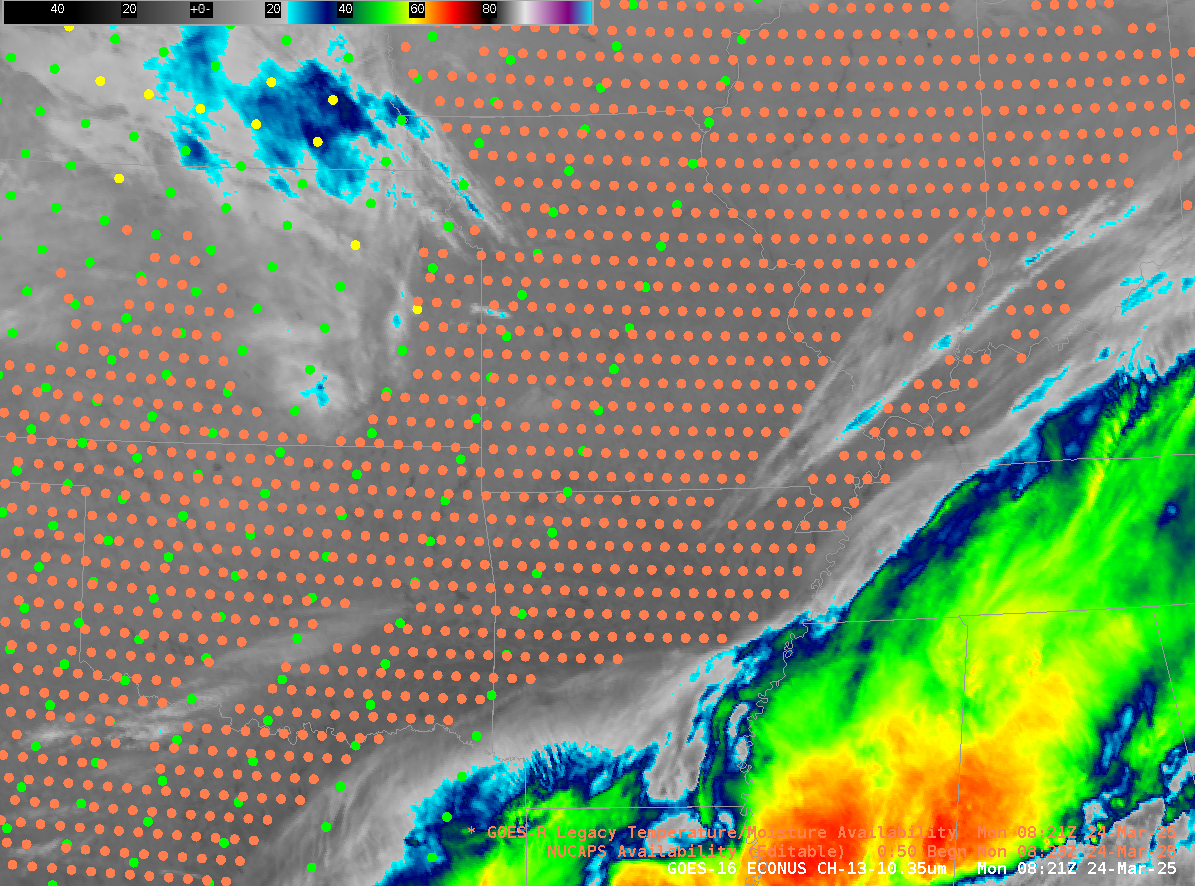
Of course, if you have clouds (or even if you don’t!), you could also look at NUCAPS profiles that incorporate microwave imagery, albeit at coarser temporal resolutions. On this day, the NOAA overpass occurred in clear skies. The image below shows NUCAPS profiles overlain with LAP data (plotted in coral) at about the same time, and also GOES-East band 13 imagery to approximate the cloud cover.
The Slider Juxtapose below compares somewhat-adjacent NUCAPS and LAP thermodynamic data at 0852 UTC on 24 March. (click here for a toggle).
These profiles do not include winds. A substitute for the winds could be from ACARS data.