Definition of a wave
A wave is a disturbance that propagates through a medium, such as space, or along an interface between two media. Waves of electromagnetic radiation do not require a medium, but can propagate in a vacuum.
Ocean wave characteristics and definitions:
- Wave height – vertical distance from highest point of crest to lowest point of wave trough
- Wave amplitude – vertical distance between highest or lowest point of a wave and a horizontal reference level, such as the unperturbed sea surface
- Wavelength – the horizontal distance between successive wave crests or troughs
- Wave number – two pi divided by wavelength
- Wave frequency – the number of waves passing a specific point per unit of time
- Radian frequency – two pi times wave frequency
- Phase speed – wavelength times frequency
- Wave steepness – wave height divided by wavelength
Ocean Wave Classification
Ocean waves are classified based on the force that generated the wave and/or to the force that seeks to restore the ocean surface to a level surface (restoring force).
A gravity wave is a wave traveling along the interface between two fluids, whose dynamics are dominated by the effects of gravity. The term ‘gravity wave’ is typically applied to wind-generated, periodic displacements of the sea surface, though nominally tsunamis are also gravity waves.
A capillary wave is a wave travelling along the interface between two fluids, whose dynamics are dominated by the effects of surface tension. Capillary waves are common in nature and the home and are often referred to as ripples. The wavelength of capillary waves is typically less than about a centimeter (from Wikipedia.org).
Remote Sensing of Ocean Waves
Gravity waves, capillary waves, and gravity-capillary waves (intermediate in scale between gravity and capillary waves) can be readily observed in remotely sensed imagery of the sea surface, particularly in Synthetic Aperture Radar (or SAR) and scatterometer data. Both SAR and scatterometers measure surface roughness, and so do not provide a direct measurement of the surface wind, but because the surface roughness varies as a function of wind speed and direction, these instruments can be used to estimate the wind. Scatterometers are most sensitive to short (millimeter – centimeter scale) waves due to a resonance phenomenon that occurs between the radar waves and the ocean waves. Short surface waves (capillary waves, gravity-capillary waves and gravity waves) are responsive to local wind conditions, and respond nearly instantly to wind forcing. For this reason, measurements of the distribution and alignment (also known as two-dimensional wave spectrum) of short, wind waves can be used to infer wind speed and direction at the sea surface for a particular location.
The global wind vector map shown in Lesson 1 ("Observing the Oceans from Space") was produced using data acquired by the QuikScat scatterometer, based on this principle. Figure 1 shows an example of scatterometer-derived wind estimates obtained during Hurricane Ivan in 2004. The streamlines show wind direction, and the color indicates wind speed.
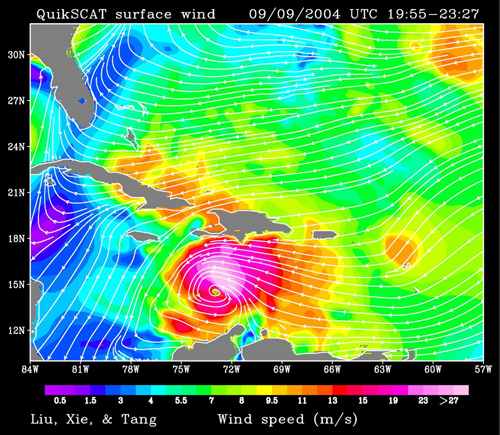
Figure 1. Surface winds during Hurricane Ivan estimated from QuikScat scatterometer measurements.
(Click to enlarge)
Scatterometer measurements have also been used successfully to map the sea ice in the Earth’s polar regions, and have been a valuable tool in tracking recent changes to these areas. These data are particularly valuable because snow and ice (and different types of snow and ice) look very similar when viewed at optical frequencies. The roughness of these surfaces can vary substantially, so radar observations have proven invaluable in mapping and measuring these remote regions.
Figures 2a and 2b are images of the Arctic and Antarctica, respectively, that were made by the Remote Sensing Laboratory at Brigham Young University.
 Figure 2a. Map of the Arctic (North Pole) produced from scatterometer measurements obtained by the QuikScat instrument. Image courtesy of NASA. (Click to enlarge) |
 Figure 2b. Map of the Antarctic (South Pole) produced from scatterometer measurements obtained by the QuikScat instrument. Image courtesy of NASA. ( Click to enlarge) |
A tsunami is a wave for which the generating force is the rapid displacement of a significant mass underwater, such as an earthquake, volcanic eruptions and other underwater explosion or landslide. On December 26, 2004, an undersea earthquake triggered a huge tsunami in the Indian Ocean that caused tremendous devastation. The Jason-1 altimeter passed over the area hours after the event and obtained the data depicted in Figure 3.
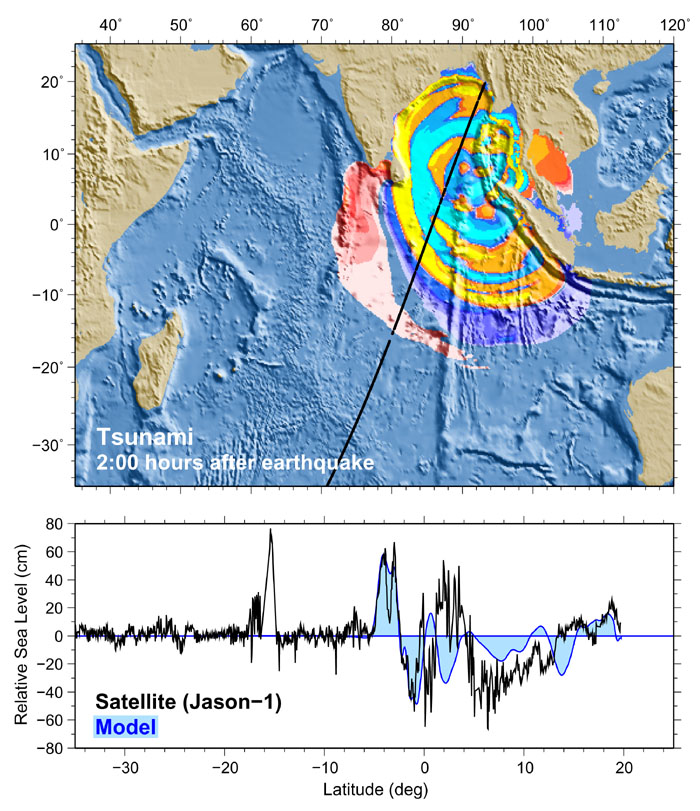
Figure 3. The image in the upper panel was created from altimeter measurements obtained by the Jason-1 system 2 hours
after the earthquake on December 26, 2004 that produced a tsunami, showing sea surface anomaly (difference from average
sea surface height) for the region. The lower panel shows variations in sea surface height along a slice through the wave
front. Measurements (black) are compared with model predictions (blue) of the wave produced by the event. Image
courtesy of NOAA.
(Click to enlarge)
Interface waves propagate along the boundary between two media, such as fluids of different densities, or the air-sea interface.
- The ocean is stratified vertically based on temperature, salinity, density.
- The world’s oceans consist of three main layers:
- Surface layer (0 – ~200m deep)
- Middle layer (~200 – 1500 m deep)
- Deep layer (after 1500 m)
- The base of the surface layer is called
- the thermocline, when considering stratification based on temperature
- the halocline when considering stratification based on salinity
- the pycnocline when considering stratification based on density
Figures 4 – 6 illustrate the location of the thermocline, pycnocline and halocline, and illustrate how salinity, density and temperature vary with depth in the ocean.
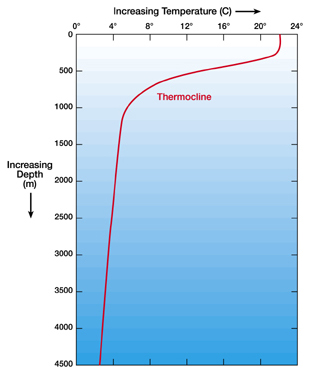 Figure 4 illustrates the decrease in the temperature of seawater with depth. (Click to enlarge) |
 Figure 5 illustrates the increase in density of seawater with depth. (Click to enlarge) |
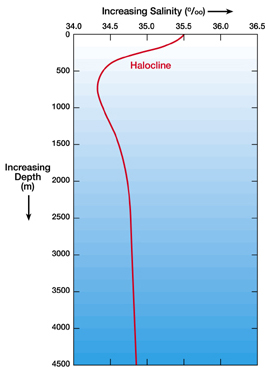
Figure 6 illustrates the variation in salinity with depth in the ocean.
(Click to enlarge)
- Ocean stratification varies
- With season – during the summer months, increased sunlight and low winds allow a steep temperature gradient to develop between the warm sea surface water and the cooler, deeper water.
- With latitude – at high latitudes, the surface water is cool and overlies deep, cold water
- Ocean stratification limits vertical water movement – circulation is mostly horizontal in areas with well-developed stratification
- There are three types of stratified fluids, based on the amount of work required to move a parcel of water vertically within the fluid. For a stratified fluid, the stability equation is defined (approximately) as the rate of change of density with depth.
- A fluid is considered stably stratified if the rate of density change with depth is positive
- A fluid is considered unstably stratified if the rate of density change with depth is negative
- A fluid is considered neutrally stratified if density does not change with depth.
Internal Waves are ocean waves that propagate underwater along the thermocline. They can have extremely large amplitude (~100 meters) and can readily be seen in optical and radar images from space.
Figure 7 is a true-color Aqua Moderate Resolution Imaging Spectroradiometer (MODIS) image of Internal waves in the Sulu Sea.

Figure 7. MODIS image of internal waves in the Sulu Sea. Image from NASA.
(Click to enlarge)
Under low to moderate wind conditions, internal waves can be readily detected in SAR imagery of the sea surface. SAR systems obtain comparatively high resolution imagery of the sea surface. Though internal waves are large-scale, features, with wavelengths on the order of hundreds of meters, they generate intense surface currents that modulate the wind-generated waves on the order of tens of meters to centimeters. Figure 8 provides an example of SAR imaging of internal waves.
 |
Figure 8. This SAR image acquired by the European ERS satellite in the vicinity of the Galapagos
Islands shows several internal wave packets. Since the Galapagos Islands are volcanic,
it is believed that these wave packets were produced by interaction of tidal flow with submerged volcanoes. (Image from CNES) (Click to enlarge) |