2019 JPSS VSF Top Projects
GOES-16/17 2019 Virtual Science Fair – 1st Place Projects
Upper Mississippi Valley
Isabella Doyle, Nathan LeBoeuf, Gabrielle Morales – Auburn Middle School, Auburn MA
COACH: Karin Loach

No Correlation Between Precipitation Amounts (Rain Gauge) & Brightness Temperature (GOES-16 ABI)
Elena Garistina, Mason Doshi, Logan Michaels, Andrew Fricke – Medford Memorial Middle School, Medford NJ
COACH: Vicky Gorman

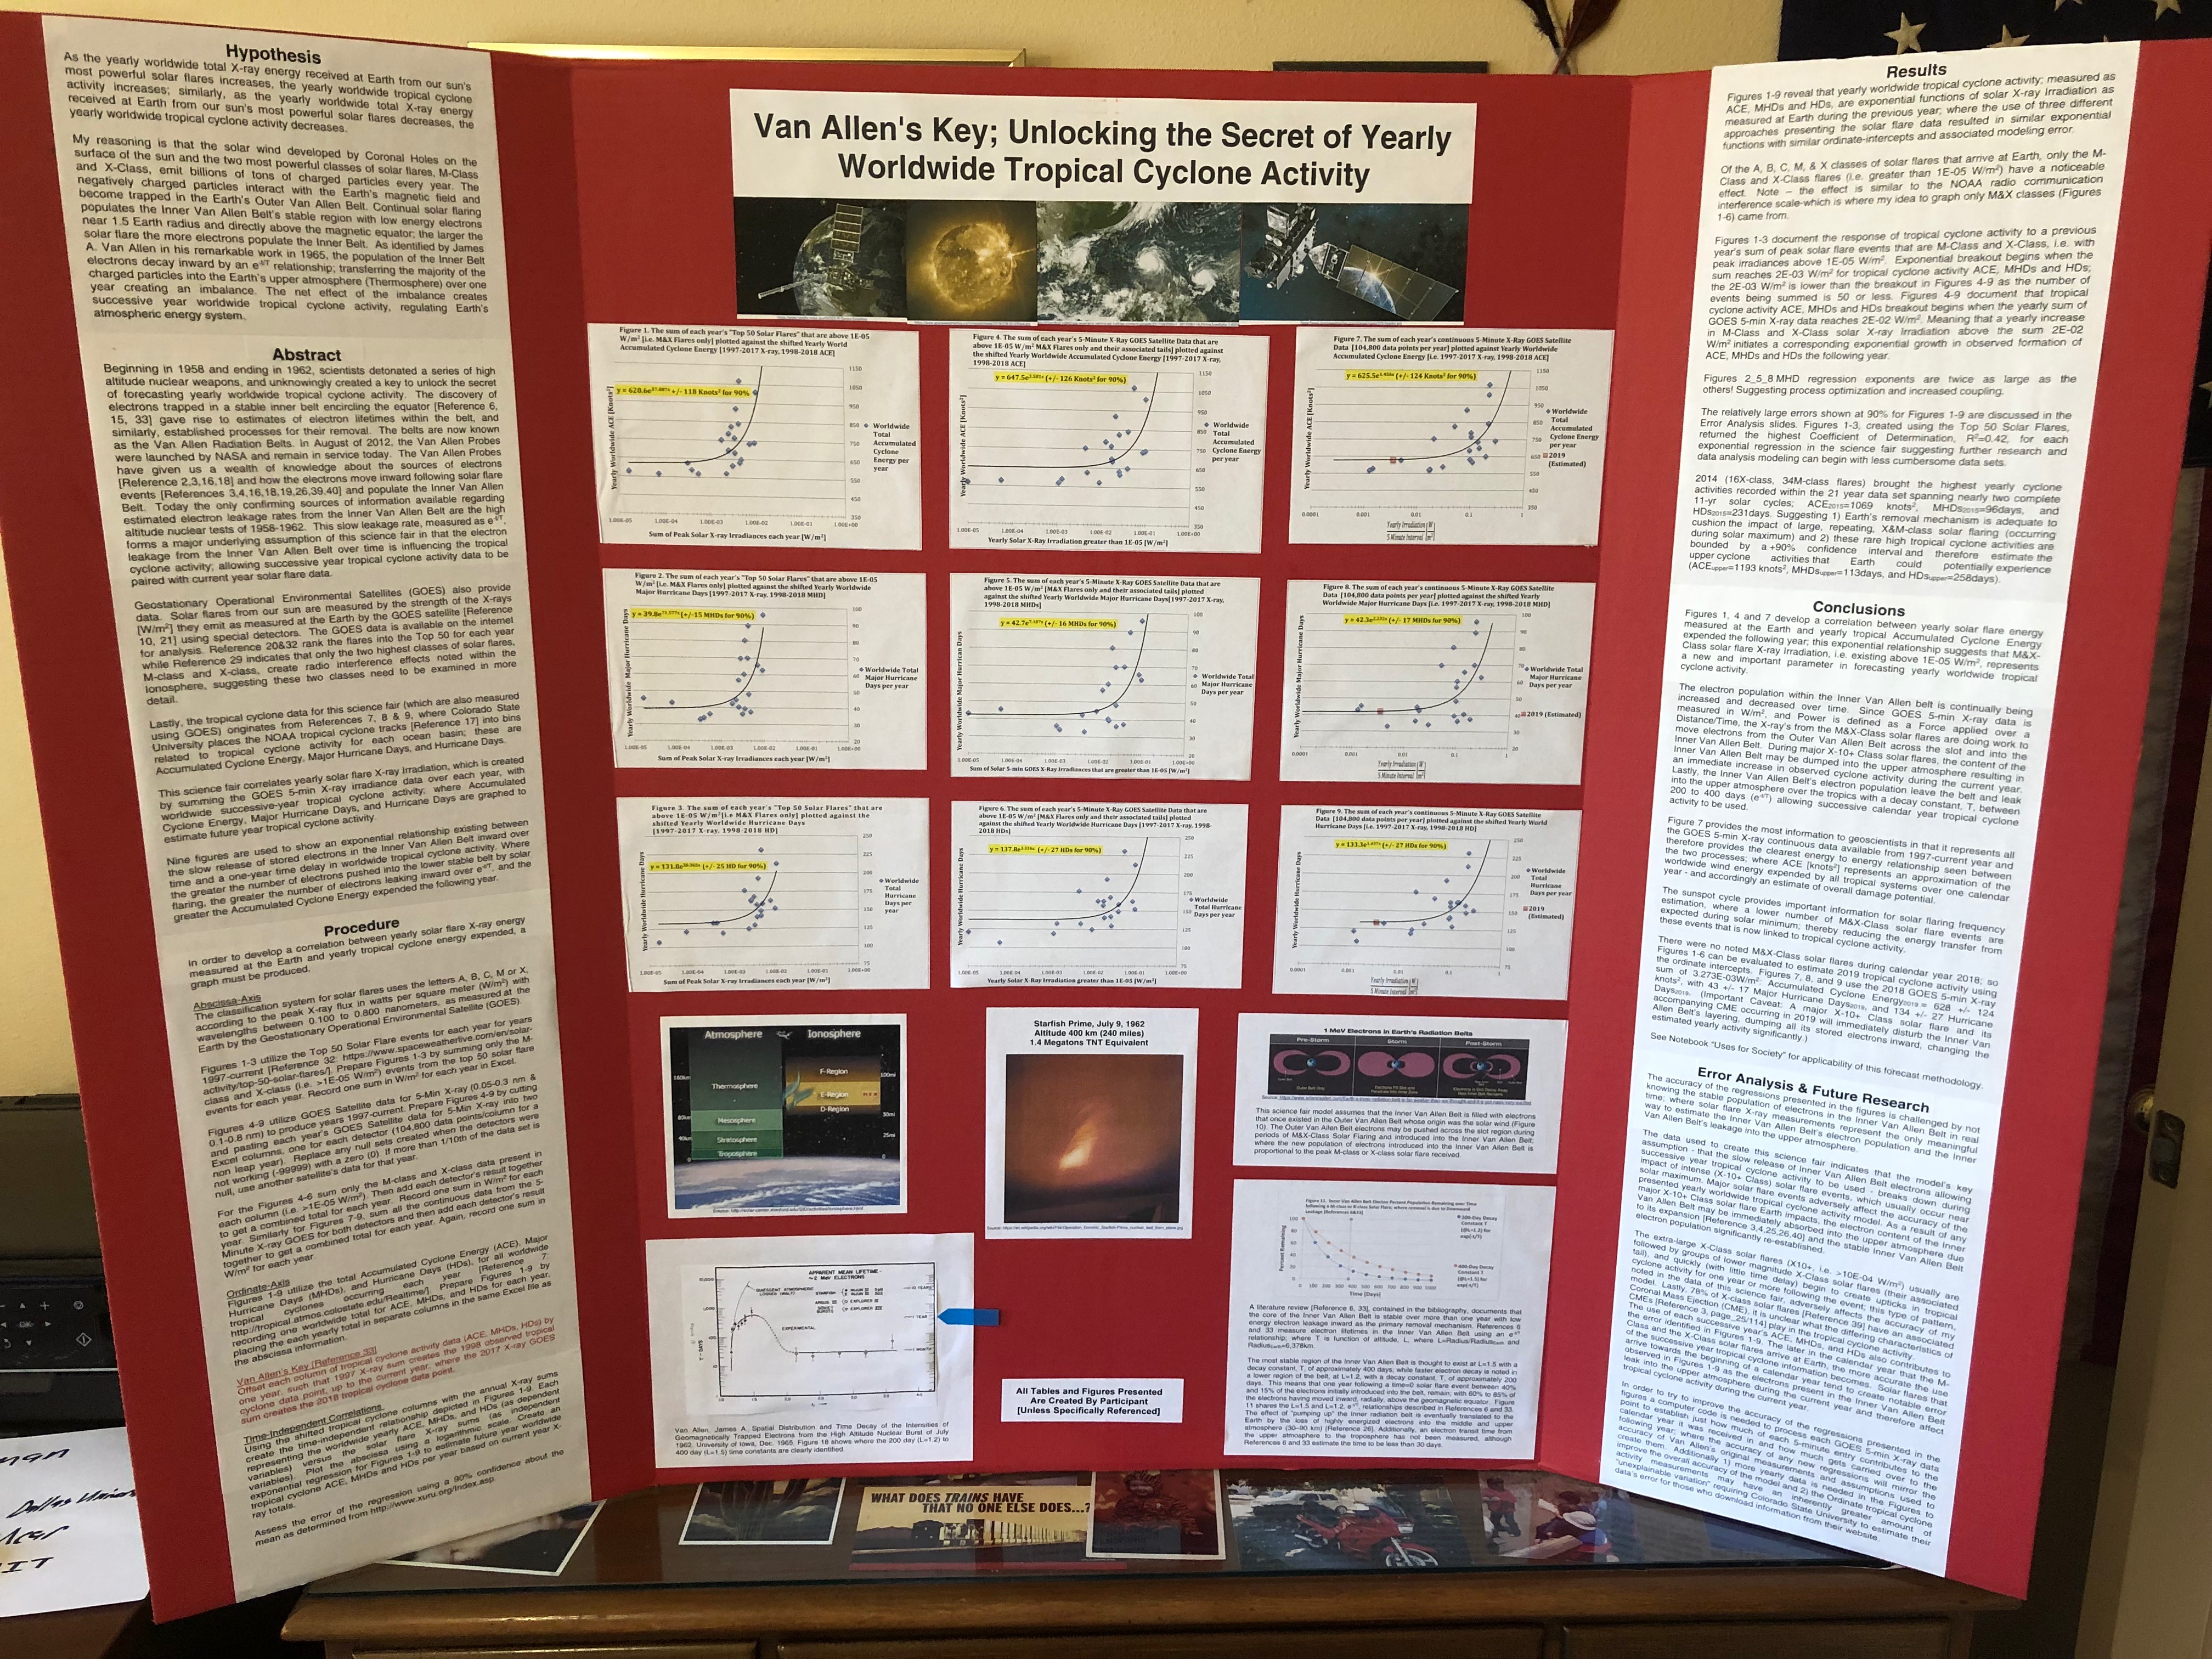
Van Allen’s Key; Unlocking the Secret of Yearly Worldwide Tropical Cyclone Activity
Faris Wald – Santa Fe High School, Santa Fe, NM
COACH: Derek Buschman
ABSTRACT: This science fair project develops a correlation between yearly solar flare X-ray Irradiation and worldwide yearly tropical cyclone activity; where Accumulated Cyclone Energy, Major Hurricane Days, and Hurricane Days, are graphed in an effort to estimate future year tropical cyclone activity. Google was accessed to locate and download yearly Geostationary Operational Environmental Satellite (GOES) X-ray 5-minute data which measures solar flare X-ray irradiance in W/m2 at Earth. Similarly Google was also accessed to locate yearly sums of worldwide Accumulated Cyclone Energy (ACE), Major Hurricane Days (MHDs), and Hurricane Days (HDs). Nine figures are used to demonstrate that an exponential relationship exists between the slow release of stored electrons in the Inner Van Allen Belt inward over time and a one-year time delay in tropical cyclone activity. As the sum of each year’s 5-minute X-ray GOES data representing irradiances above 1E-05 W/m2 [M&X Flares only] are plotted against worldwide yearly ACE, MHDs, and HDs for each successive year [i.e. 1997-2017 X-ray, 1998-2018 ACE, MHDs, HDs]; a time-independent exponential relationship is formed which estimates future year worldwide ACE, MHDs, and HDs. The accuracy of the models is presented statistically and graphically. The year 2018 has been a quiet year with regard to solar flare activity with no M or X class solar flares being recorded by NOAA GOES-16. The exponential regressions contained in Figures 7, 8 and 9 return 2019 tropical cyclone activity estimates: ACE2019= 628 +/- 124 knots2; with 43 +/- 17 MHDs2019, and 134 +/- 27 HDs2019.
View the teams SCIENTIFIC POSTER View their PRESENTATION

MIDDLE SCHOOL PROJECTS VIRTUAL SCIENCE FAIR HIGH SCHOOL PROJECTS