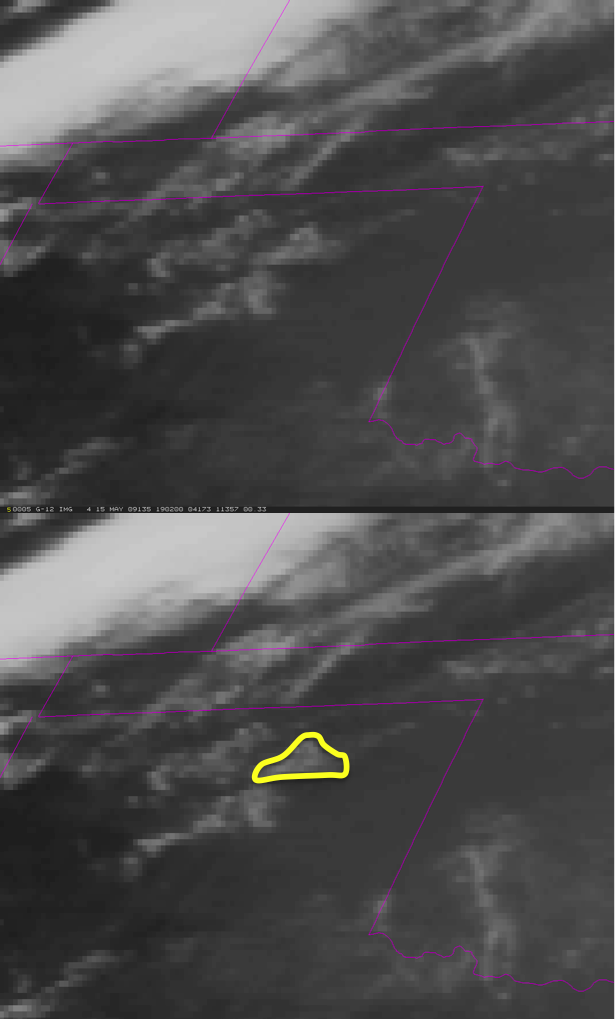
The NOAA/CIMSS ProbSevere model utilizes GOES satellite imagery for both identifying and tracking cloud clusters as well as quantifying growth rates of clouds. Below
is an example of GOES cloud cluster identification and tracking for a developing thunderstorm over the Texas panhandle. The top row of images is IR-window brightness temperatures and the
bottom row are the same images with an illustration of how cloud clusters are identified and tracked by the computer.
The satellite tracking uses infrared data--so the tracking is the same day and night. Within each cloud cluster the computer identifies and tracks, two satellite growth rates are computed: the normalized vertical growth rate and the cloud-top glaciation rate. The normalized vertical growth rate uses a field known as the top of troposphere emissivity (Pavolonis 2010). The vertical growth rate computed using this field is analagous to brightness temperature cooling rates, except the growth rates are normalized for varying tropospheric depth/tropopause height, while raw brightness temperature data are not. The cloud-top glaciation rate uses GOES/GOES-R cloud phase/type algorithm output to characterize how quickly the cloud-tops change from water phase to ice phase. The statistical model supplemental material shows how these two growth rates, along with radar and NWP data are used within the NOAA/CIMSS ProbSevere model.