
Weather Forecasting
A California Case Study - II
From the previous satellite loop you should have been able to see the big storm brewing
over the Pacific Ocean.
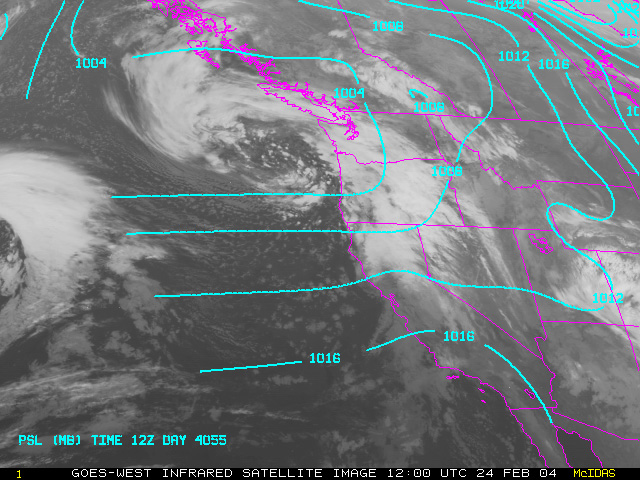
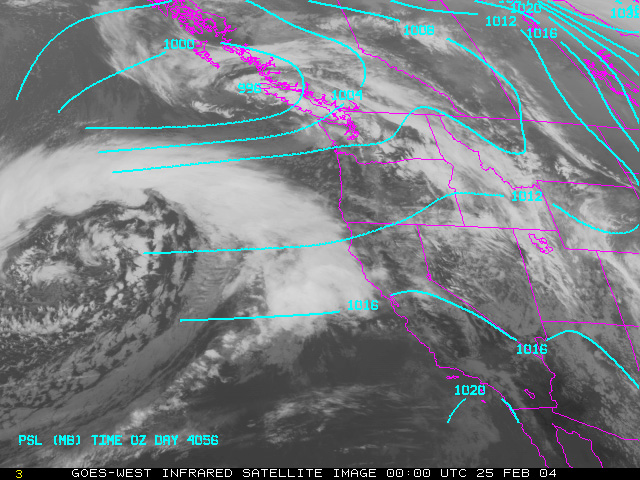
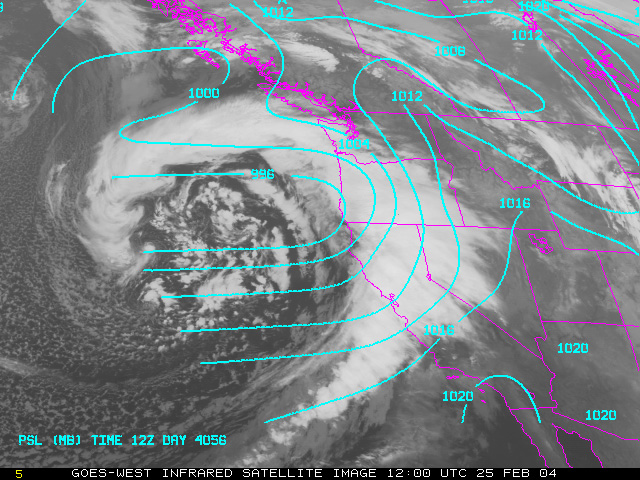
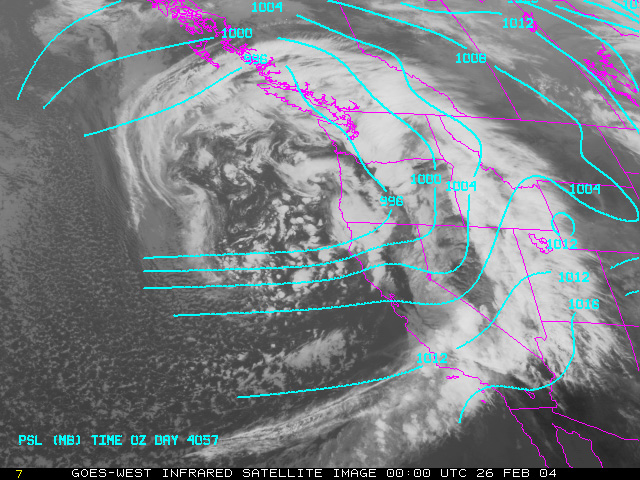
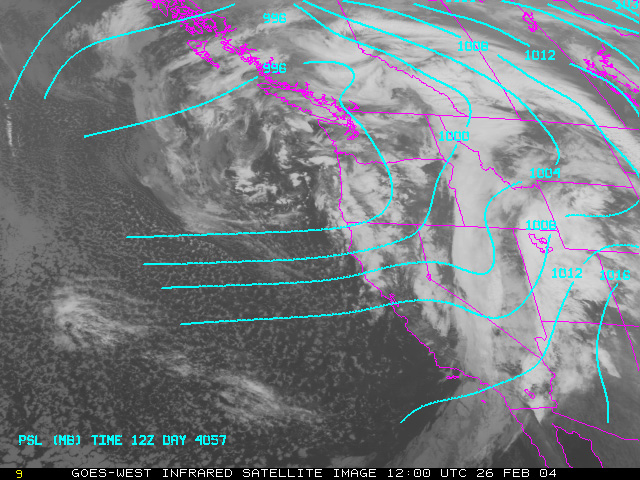
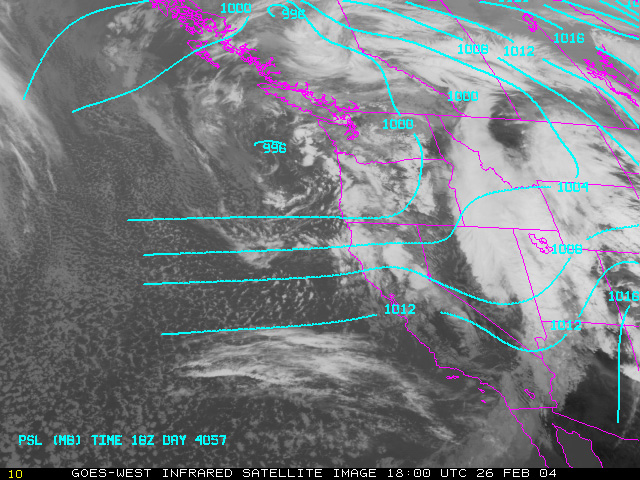
Let's look at some more information about this weather system. Here are isobars over the images. Notice how the lines aren't connected over the ocean. This is because the computer drew these isobars from the pressure values in the surface station weather observations. Except for a few buoys, we don't have surface observations over the oceans.
 [1] |
 [2] |
 [3] |
 [4] |
 [5] |
 [6] |
The lack of surface observations over the ocean is a significant forecast challenge on the west coast of the United States. It should be obvious how important satellite images are for weather forecasters. Here is the looped animation showing the weather system every 6 hours.
| 8 / 12 |