Satellite images are one of the most powerful and important tools used by the meteorologist. They are essentially the eyes in the sky. These images reassure forecasters to the behavior of the atmosphere as they give a clear, concise, and accurate representation of how events are unfolding. Forecasting the weather and conducting research would be extremely difficult without satellites. Data taken at stations around the country is limited in its representations of atmospheric motion. It is still possible to get a good analysis from the data, but because the stations are separated by hundreds of miles significant features can be missed. Satellite images aid in showing what can not be measured or seen. In addition the satellite images are viewed as truth. There is no chance for error. Satellite images provide data that can be interpreted "first-hand".
Satellites images give a good representation of what is happening at every point in the world, especially over oceans where large gaps in data occur. Data can only be taken at certain points around the world, though, without this data, forecasting would be just as difficult as not having satellites. It is essential to have both. Having the two together gives a much better understanding as to how the atmosphere is behaving and greatly improves forecasting accuracy.
There are two types of satellites that orbit the Earth, polar and geostationary. Geostationary Operational Environmental Satellites (GOES) remain above a fixed location on the Earth's surface, approximately 22,500 km above the equator. Because the satellites rotate with the Earth, they always view the same portion of the globe. The polar orbiting satellites, in contrast, orbit at much lower elevations (800-900 km). Their path is 2,400 km wide centered at the orbit path. The polar satellites observe a new path on each orbit. Polar satellites are not as useful to operational meteorologists because they do not continuously view the same area. Geostationary satellites allow meteorologists to view the weather as it develops since they view the same area continuously.
There are many different types of satellite images. Of most use to meteorologists is the visible, infrared, and water vapor images. All of these images can be taken with one satellite located out in space.
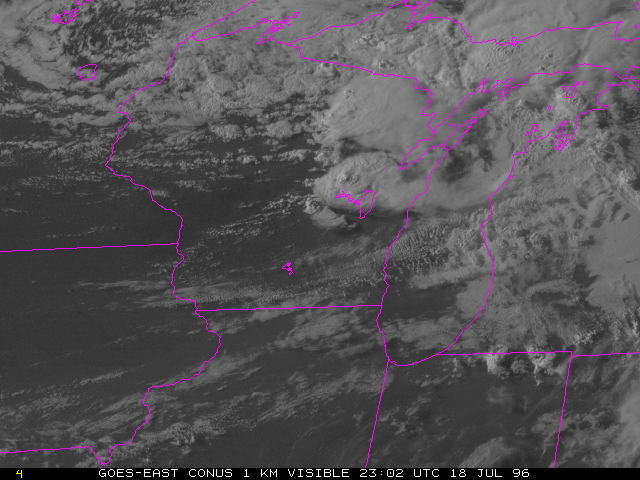
The visible satellite images are equivalent to taking a picture with a normal camera. Light is required for images to be photographed. For this reason these images are only useful when the sun is shining on the area to be photographed. The visible satellite image above was taken at 6:00 PM, almost one hour before the tornado roared through Oakfield. This image shows the massive thunderstorms located on the eastern side of Wisconsin. There are several distinct cloud towering masses protruding up from the Earth's surface seen in the image. The visible satellite also allows one to visualize the clouds as almost 3-D. This can be done by seeing different structures within the cloud masses.
Dark areas represent clear weather where the satellite can see down to the Earth's surface, while the lighter shades indicate cloud cover. The circular orientation of clouds in the the northeastern Minnesota is the location of air wrapping around the low pressure system. These clouds are not as bright as the thunderstorm clouds so we can expect the weather underneath them to be somewhat different. The presense of clouds does not always imply precipitation. The circular clouds associated with the low are a little lighter. From the visible satellite image we can not tell if these slightly lighter clouds are producing rain, as all cloud types are treated equally. The infrared satellite image can help us in distinguishing rain clouds from other types, which makes it a remarkable tool.
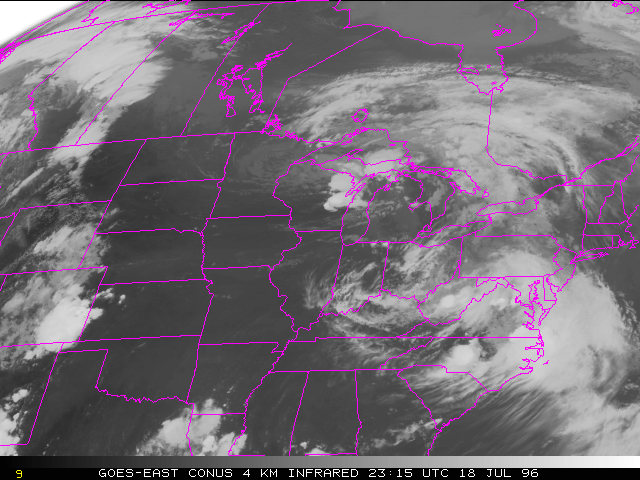
Infrared measures heat. Dark areas represent warmer temperatures, while white areas signify colder temperatures. The clouds over northwestern Wisconsin and northeastern Minnesota hardly show up in the infrared image. They are a much darker shade and are almost transparent. Brighter clouds are higher up in the atmosphere than darker clouds. They are much colder than low clouds. Cold and bright clouds signify a deep layer of moisture, which ultimately signifies precipitation. From this satellite image we would then expect heavy rain associated with the deep bright white thunderstorm clouds. For precipitation to occur clouds must be fairly deep. The clouds will become colder as they rise high up into the troposphere and will acquire a white appearance. The tops of the clouds need to rise up to -20 degrees Celsius (-4 degrees F or 253 Kelvin) for precipitation to form. The clouds in the Ohio River Valley are white as well. Meteorologists need to be careful in assuming all of these clouds are producing precipitation. Cirrus clouds often form at high altitudes and show up well in the infrared but produce no precipitation. Experienced meteorologists are able to recognize most of the clouds over Tennessee and Indiana are cirrus, as recognized by their feather like appearance. Because infrared images can be taken when it is dark, they are extremely valuable, especially in locations where there isn't much sunlight, like in the winter months of Alaska.
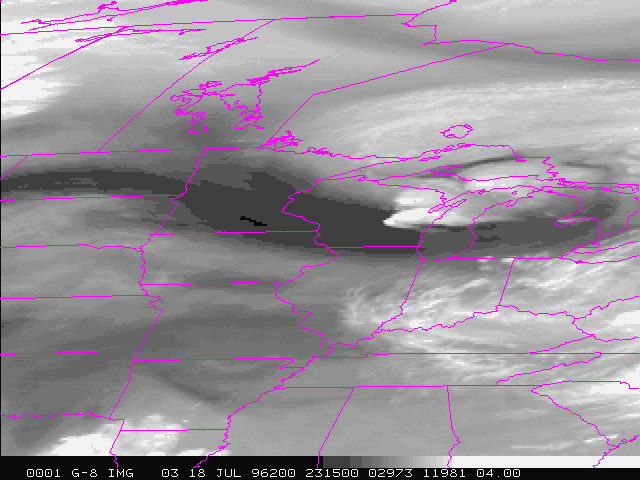
The water vapor image is another valuable tool in satellite analysis. Water vapor images, as the name implies, shows regions of water vapor located in the upper troposphere. Generally dark areas represent dry air, while whiter areas show moist air. Dark regions can be associated with air that is being forced downward toward the Earth's surface. This air has had all of its water condensed out and can then behave differently from moist air. The dry air usually represents fair weather and the whiter, more moist air, shows regions where this moisture can be possibly converted into clouds or precipitation.
Large amounts of water vapor in the thunderstorms over Wisconsin can be seen in the image above. When very bright water vapor regions are noticed, heavy rains and flash flooding are a severe weather criteria to look for. The vast amount of water vapor is being forced upward high into the troposphere and into the stratosphere. The large amount of moisture means heavy rain will accompany these large thunderstorms. The dark area running through Minnesota and Wisconsin represents the location of the jet stream.
Only rare weather phenomenon penetrate into the stratosphere. Thunderstorms are usually the main atmospheric feature that can do this. When a storm protrudes into the stratosphere this is very remarkable and should be taken very seriously by forecasters. The higher up into the atmosphere a storm gets the more severe the consequences may be. The cloud tops from the thunderstorms over Wisconsin reached over 53,000 ft. The beginning of the stratosphere at 7:00 PM on this day was approximately 37,000 ft.
Putting all three types of satellite images together it becomes apparent the significance of the weather event. The visible image shows the 3-D nature of the low pressure system and the developing storms. The infrared helps specify which cloud areas are likely causing the most notable weather. The water vapor indicates where the most moisture in the upper levels is located and the associated jet stream. The storms over Wisconsin can then be seen as dangerous with a close watch needed to monitor how the situation is likely to change. Satellite images are taken several times an hour. Looping them together shows the formation and likely propagation of significant weather features.
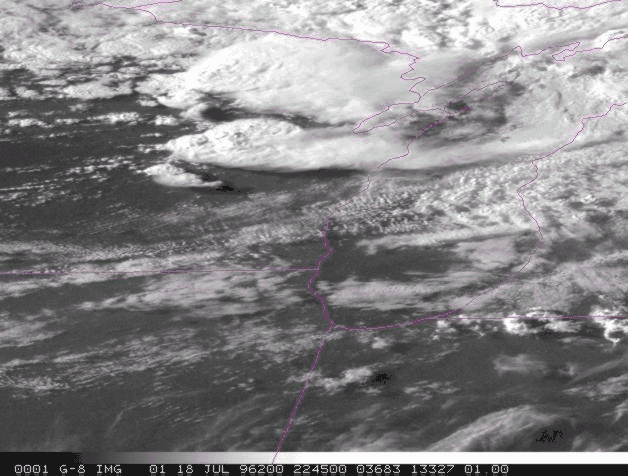
For large scale synoptic features the past satellite images were very useful, though, as for viewing small scale features, like thunderstorms, a closer picture would be more valuable. A close up view of the thunderstorms from July 18th gives a better understanding of the storm development and structure. Notice the regions on the east sides of the storms tend to show less definition. Strong upper level winds are fanning the cloud tops eastward. As this once thick dense cloud is being spread out over a greater distance it loses its shape. This region of dispersed cloud is often termed the anvil. The supercell that spawned the tornado is just beginning to develop and can be seen as the smaller cloud area just below the two significantly larger storm clusters.
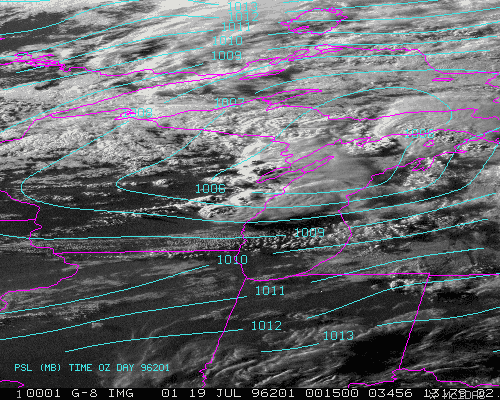
The pictures taken over Wisconsin during this severe storm event shows the importance of satellite imagery. Data from surface and upper-air also was very important in showing low pressure systems and fronts. There was a need for having the two together to aid in forecasting and research. Because of the need for both, the Man computer Interactive Data Access System (McIDAS) was developed here at the University of Wisconsin-Madison in the Space Science and Engineering Center (SSEC). This valuable tool interprets all the surface and upper-air data from stations all over the world. This data can then be directly plotted or contoured onto the satellite images.
Animated satellite images of the storms that produced the Oakfield tornado are provided. These files are very large and requires an FLI player. This site provides information for obtaining FLI capability.
When viewing these animations pay close attention to the storms erupting along the cold frontal boundary and dry air wrapping around the center of low pressure (water vapor animation).