Radar works much the same as an X-ray machine that doctors use to examine the body. Meteorological radar uses the microwave region of the electromagnetic spectrum, wavelengths between 3 and 10 cm, to look into and analyze cloud and storm structures. Radar works by sending out millions of these microwaves, which interact with frozen and nonfrozen water particles throughout the atmosphere, such as rain, snow, hail, or clouds. When the microwaves encounter these particles a small portion of their energy is scattered in many directions. Some of this scattered energy is returned to the radar instrument where it is received and interpreted. The strength of the returning signal indicates rainfall intensity, while the time difference between the transmission and return of the signal indicates the distance to the storm. Large and more numerous particles reflect the waves with a greater intensity than smaller and fewer ones. Doppler radar also recognizes differences between atmospheric ice and water droplets. The signals received back from the reflected particles can be interpreted to show how much and what type of precipitation is falling. Intensity of precipitation is usually depicted on a computer image which scales the intensity by various colors.
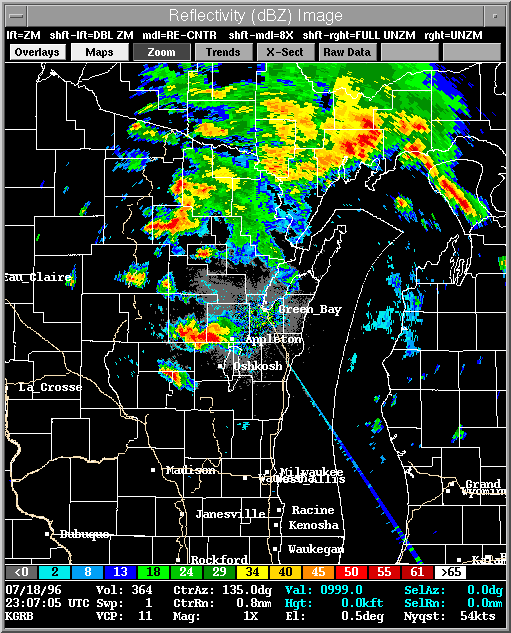
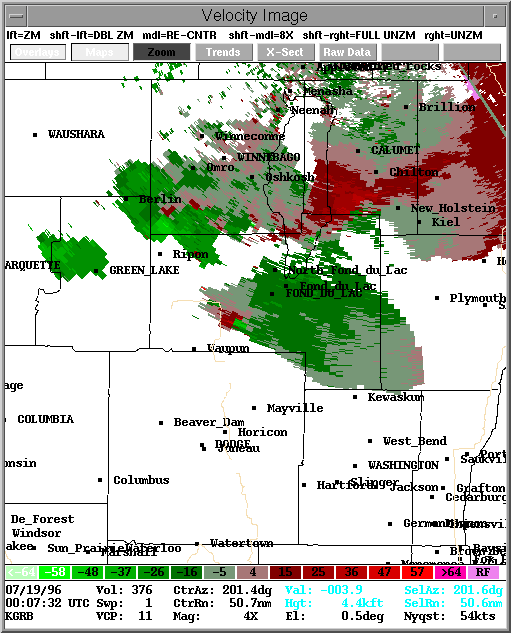
The Doppler image above indicates heavy returns from the two thunderstorm cells. From the scale at the bottom of the image, the reds and purples represent the more intense reflectivity, heavier precipitation, while the blues and greens show lighter precipitation, some of which may evaporate before reaching the ground. The black areas show there is nothing interfering with the signals, a clear atmosphere.
The intensity amounts are usually referred to as "echoes". Echoes refer to the reflection of the waves, like the echo one hears from yelling in a canyon. Strong "echoes" refer to large amounts of falling precipitation and deep clouds. Doppler radar is one of the most advanced versions of radar. It receives and interprets typical radar signals, but more importantly it analyzes how fast and in what direction the winds and precipitation are moving.
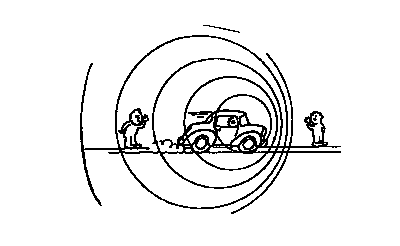
The Doppler radar gets its name from the association it has with the Doppler effect. The Doppler effect is usually described using soundwaves as opposed to microwaves. By definition it is the change in the observed frequency of waves produced by the motion of the wave source and/or the wave receiver. The passing of an ambulance shows how the doppler effect works. As the ambulance approaches the siren becomes very loud. As soon as it passes by the intensity of sound suddenly drops significantly. The reason is due to the motion of the ambulance toward you altering the orientation of waves. If there was no motion the waves would be equal distance apart in all directions. Instead, the waves are compressed together in the direction of the moving object.
 This compression of waves
increases the intensity of sound to the observer due to the increasing frequency of
waves. The meteorological use
of doppler radar is very similar. The movement of precipitation
toward the radar increases the frequency of reflected pulses, where as motion
away from the radar decreases the frequency. Doppler analysis of winds can
determine if the flow is toward or away from the radar unit.
This compression of waves
increases the intensity of sound to the observer due to the increasing frequency of
waves. The meteorological use
of doppler radar is very similar. The movement of precipitation
toward the radar increases the frequency of reflected pulses, where as motion
away from the radar decreases the frequency. Doppler analysis of winds can
determine if the flow is toward or away from the radar unit.
The primary use of Doppler radar is it's ability to look into thunderstorms internal structure. Atmospheric scientists have recognized characteristics in thunderstorms that will likely lead to tornadic development. The Oakfield tornado is a classic case of how valuable Doppler radar is in predicting tornadoes. The shape of the thunderstorm cell is one feature that can help recognize if tornadoes are likely. The Oakfield cell has almost a kidney bean shape (see image below). Storms shaped like this have been notorious for producing tornadoes. A forecaster can sometimes recognize this type of cell and warn the public that a tornado may likely occur well in advance of a tornado sighting.
Before Doppler radar, tornado warnings could not be issued until the actual tornado was sighted, giving no time to warn the public about the advancing danger. Two products of Doppler radar are reflectivity and wind velocity. Reflectivity, as described above, is associated with the intensity and movement of the precipitation. The wind velocity is associated with the intensity and movement of the winds. Reflectivity is primarily used to find cells where tornadoes are likely to occur, usually in supercellular thunderstorms. Supercellular thunderstorms occasionally have a unique hook shape. A hook echo is the most likely region for strong tornadoes to develop and is usually found in the back corners of the cell. The Oakfield tornado had a classic hook echo shape. Comparing the Oakfield supercell with a conceptual supercell model shows many striking similarities.
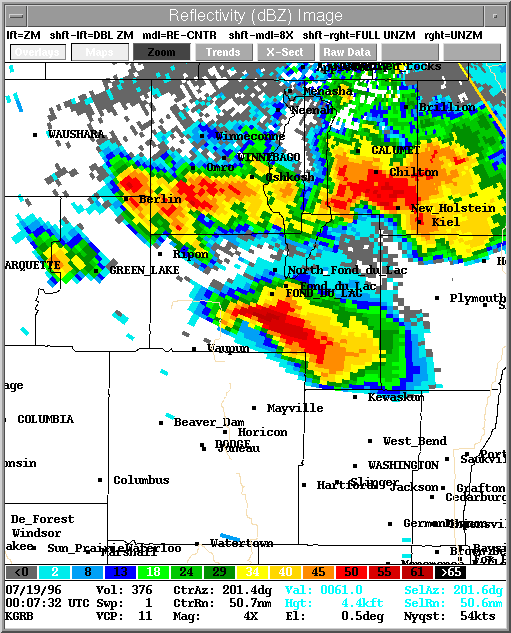
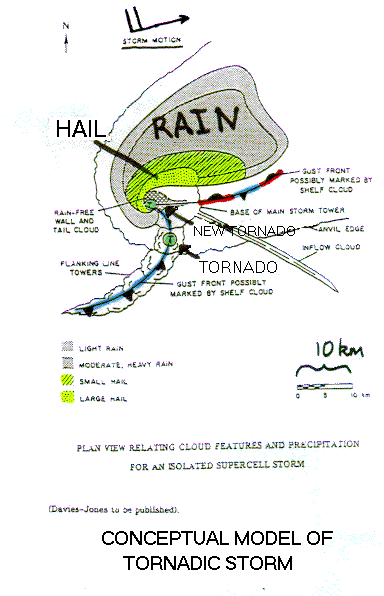
The figure below shows a conceptual model of a supercellular thunderstorm. The green circles with a "T" in the middle represents tornadoes. These types of storms often produce a family of tornadoes as the storm moves. The first tornado can maintain its structure for some time as the storm moves away, allowing new tornadoes to continuously form in the hook region of the cell. The hook region is favored for tornadic development since it is the location of the strongest updraft into the cell, and where the greatest rotation of air is occurring. Large hail is often found near the hook as well. The Oakfield tornado had many of these characteristic features associated with it. The tornado formed in the hook region with nearby reports of hail, though, it is unclear whether more than one tornado developed out of this cell. Notice how the hook is right over Oakfield in the radar images.
Reflectivity and velocity loops of the storm system that produced that Oakfield Tornado are provided. These loops require java to be enabled on the browser.

Any questions or comments can be sent to
jasonb@ssec.wisc.edu or toma@ssec.wisc.edu