

The tornado was born close to 7:10 PM. Radiosondes were launched at 7:00 PM (00Z), allowing them to take conditions at nearly the exact time as the tornado. This is a very lucky coincident, making the analysis ideal.
Surface Conditions Minutes Before the Tornado:
Surface Pressures Uncontoured : Surface Pressures
The center of the system is now positioned over Wisconsin. In the 12 hours there has been little change in the strength of the low. The high has shifted slightly to the east while weakening by 3mb. Flow around it continues to feed moisture into the Midwest, though, with the eastward shifted high, the moisture should likely progressively increase in the Northeast.
Surface Temperatures Uncontoured : Surface Temperatures
There is a large temperature gradient separating air masses over Wisconsin. The collision of these two very different air masses is producing powerful storms over Wisconsin.
Surface Dewpoint Temperatures Uncontoured : Surface Dewpoint Temperatures
Surface dewpoint temperatures are extremely high over south central Wisconsin, Iowa, and the Ohio River Valley. Dewpoint temperatures have increased over the Ohio River Valley and the Northeast as expected from the eastward shifted high and low pressure features. The maximum dewpoint temperature stretches up toward the Oakfield region. Dewpoints are higher over Wisconsin and Iowa than right near the Gulf of Mexico! As stated above, this is likely attributed to the increased evapotranspiration of farmland in this region. The atmosphere contains large amounts of moisture for the development of strong storms. Dewpoint temperatures on the west side of the front are considerably lower as indicated by the 20°F gradient over northwest Wisconsin. The development of storms is likely in this region due to the large gradients and surface convergence. The satellite imagery shows storms developing along this gradient.
Surface Winds Unstreamlined : Surface Winds
Surface winds continue to show the flow from the Gulf of Mexico advecting moisture into the the Midwest and Ohio River Valley. Winds have increased over Wisconsin and Illinois shifting from the west/southwest. The most important feature is the colliding of streamlines over Wisconsin and Iowa. This collision is forcing the air upward to help produce the powerful storms. These colliding streamlines match up with the large dewpoint gradient providing the location for the cold front. The streamlines can be explained by the atmospheric pressure field above.
850mb Dewpoint Temperatures Uncontoured : 850mb Dewpoint Temperatures
The analysis shows a large pool of moisture in southern Wisconsin, helping to support storm development. The high amount of moisture will help fuel the long lasting storms like those produced.
850mb Winds Unstreamlined : 850mb Winds
Winds out of the Gulf continue to feed energy and moisture into the center of low pressure. Air from Canada is also flowing south along the west side of the cyclone. The winds over much of the central US at 850mb have increased compared to the surface. However note the winds changing direction and speed with height, an extremely important characteristic in determining what types of thunderstorms will develop. Supercellular thunderstorms require the winds to increase and change direction with height. There are several categories of thunderstorms, characterized by size, internal structure, and organization. The supercellular class of thunderstorms are notoriou for producing tornadoes, making them dangerous and requiring special attention by forecasters. Supercells are predominately the type of thunderstorm that produce tornadoes stronger than F3 status.
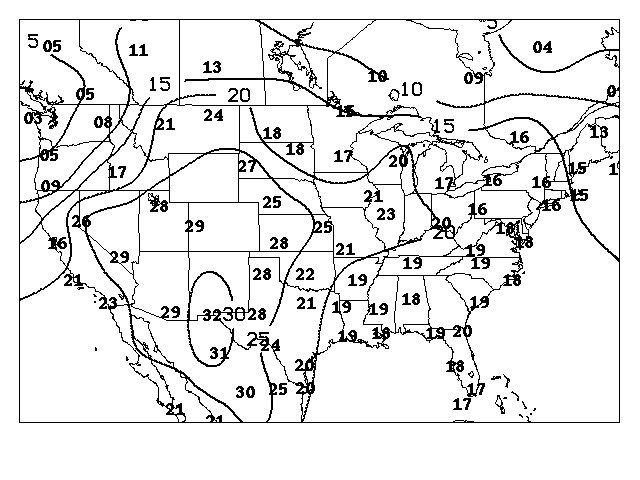
850mb Temperatures Uncontoured : 850mb Temperatures Contoured
Mesocyclonic thunderstorms (supercells) were ongoing in eastcentral and northeast Wisconsin at 0Z. The cap that contained extreme instability all day finally broke during the afternoon hours, between 12Z and OZ. Numerous reports of tornadoes, large hail, and damaging winds were noted along the path of these intense thunderstorms as they moved from northwest to southeast across the state. More synoptically, an inversion still remained over the Upper Midwest. 850mb temperatures remain in the 20-25 degree (C) range over the state of Wisconsin. However, the low pressure system has begun to draw colder air in from Canada, noted by the temperatures falling in Minnesota and northwest Wisconsin. Interestingly enough, although the cap has already broken in eastern Wisconsin, the cap still remained firm along the cold front stretching into southwest Wisconsin. Thunderstorms tried to develop southwestward, but failed to do so, as the warm-air inversion in the lower atmosphere (which can be noted by the 800-850mb temperatures through the Davenport sounding) surpressed cloud growth. As is usually the case, the southern most thunderstorm often times has the most readily available engery; making southwest Wisconsin, where the instability was still contained under the capping inversion (think of a closed, boiling pot), an area of potential explosive thunderstorm development.
500mb Uncontoured Isotachs : 500mb Winds
Compared to the 12Z analysis, the area of maximum winds have shifted from the Dakota's and Minnesota to Wisconsin and Minnesota. The streamlines are diffluent over Wisconsin and Illinois, providing the necessary dynamics for thunderstorm development, as surface parcels can rise more freely in the atmosphere. The 500 mb winds continue to show the aforementioned wind increase and direction change with height compared with lower levels. Once again, with this wind profile thunderstorms are likely to be supercellular in structure.
500mb Uncontoured Geopotential Heights : 500mb Geopotential Heights
Since the 12Z analysis the geopotential heights have decreased by 40m over Green Bay, WI but have increased by 20m over Minneapolis/St. Paul. This large decrease in geopotential height over Wisconsin shows the prominent forcing mechanism is positioned over Wisconsin. The 500mb trough is moving fast over the Midwest preventing thunderstorms from affecting locations for long periods of time. The upper-level trough has shifted to the east, though the exact center of the cyclone is difficult to position from the data, as the stations are separated by hundreds of miles.
As an aside, heights over the south and southeast are nearly uniform. Pleasant weather is often associated with this, though being close to the moist Gulf of Mexico, forecasters need to still analyze the southeast due to the very high dewpoints at the surface. Daily thunderstorms often erupt over Florida and southeast coastal regions without a low pressure feature. These air-mass thunderstorms are usually short in duration but can be seen in the satellite imagery.
250mb Uncontoured Isotachs : 250mb Wind
The core of the jet stream is located right over Wisconsin. Divergent streamlines over central and southern Wisconsin also provide lift for the surface air parcels, though it is not as impressive as the 12Z analysis. With the strong jet streak and divergence, the dynamics are still there for producing the thunderstorms. With the inversion being weakest in the afternoon and evening, less powerful divergence is required for thunderstorm development.
Mesoscale refers to small scales. Mesoscale can be as small as a few kilometers and as large as a few hundred kilometers. A mesoscale analysis often brings out significant features that are missed by doing a large scale analysis. For example, the maps of sea level pressure shown above have a minimum pressure of 1004mb. By doing the meso-analysis below, it becomes apparent that pressures are actually less than that. Because the stations are much closer to each other, better accuracy can be provided in the forecast, not to mention the better resolution of the atmospheric features.
A map showing some of Wisconsin's cities is available for reference. Oakfield is just a few miles southwest of Fond du Lac.
18Z August 18th Surface Analysis:
18Z Temperatures Uncontoured : 18Z Temperatures
A temperature maximum occurs over southwestern Iowa, Nebraska, and Missouri, though temperatures have reached 90°F in La Crosse, WI. There is a large gradient of temperatures over the Midwest, especially over Minnesota, where a 20°F difference exists from the northern part to the southern locations. Temperatures are much cooler in Milwaukee, WI and the northern part of the state. Much of this can be attributed to the location of the warm front, though the lakes may be having some influence on moderating the temperatures of the air mass, especially over Lake Superior where temperatures near the lake are below 60°F. The temperature is 83°F in Madison, which is about 60 miles southwest of Oakfield. Madison will be used as a reference location to the conditions in Oakfield. From the contour analysis the temperature in Oakfield is approximately 80°F.
18Z Dewpoint Temperature Uncontoured : 18Z Dewpoint Temperatures
Dewpoint temperatures are at a maximum over Iowa, where they are pushing the upper 70's. Dewpoints in this range are very rare for the Midwest. With temperatures close to 90°F, with high dewpoints, one should use caution when going outdoors, especially exercising or doing hard work as the body can't cool itself as fast as it's heating up. The high dewpoints cover most of Wisconsin as the dewpoint in Madison is 76°F, giving Oakfield an approximate dewpoint of 74°F. There is a large gradient of dewpoint temperatures running from the upper 70's in northern Iowa to the low 60's in eastern South Dakota. This large gradient signifies the cold front.
18Z Pressures Uncontoured : 18Z Pressures
The minimum atmospheric pressure is located just west of Oakfield. The large scale analysis showed the minimum pressure to be close to 1004mb. The mesoscale analysis shows the cyclone is much stronger than what was first analyzed, almost 4mb lower. The 1002mb contour is very localized and appears to be heading directly toward Oakfield. The 1006mb contour is actually two separate regions, but is only separated by two tenths of a millibar. The largest gradient of pressure contours exists from central Wisconsin to Chicago, IL. The approximate pressure in Oakfield is 1007mb, still well short of being at the center of the cyclonic circulation.
18Z Winds Unstreamlined : 18Z Winds
The streamline analysis shows that there is a center of circulation in northern Minnesota. This would tend to show the actual center to be well away from the central Wisconsin minimum. A decision must be made at this point. Is the 1000.8mb in central Wisconsin an error in the data? All other locations around it have readings much higher. Because of this fact, I'm going to assume the center of the system is in northern Minnesota. Is it a calibration error, printing error, or real? We will look at the 21Z to determine this. The streamlines do show convergence stretching from southern Minnesota and northern Iowa into central Wisconsin. This is the location of the cold front and the likely location of thunderstorm development. It also matches up well with the location of the temperature and moisture gradient.
21Z August 18th Surface Analysis:
21Z Temperatures Uncontoured : 21Z Temperatures
Compared to the analysis 3 hours ago temperatures have increased by close to 5°F in most locations, especially west of the Great Lakes. Temperatures in west and central Wisconsin are now reaching into the upper 80's to low 90's. Madison was a rare exception by only increasing 2°F, although Milwaukee's temperature increased by 13°F. The heat is really building over Iowa, Illinois, Nebraska, and Wisconsin. There is a large gradient now existing over southern Minnesota and across Wisconsin with a greater than 20°F difference, indicating the locations of the warm and cold fronts. The gradients are more tightly packed compared to the 18Z analysis showing a better defined air mass. Temperatures over the Great Lakes remain much cooler. The approximated temperature of Oakfield is 84°F.
21Z Dewpoint Temperatures Uncontoured : 21Z Dewpoint Temperatures
Dewpoint temperatures have remained fairly constant with a slight increase over much of the pictured area. The 65°F contour expands eastward as it pushes the front into Wisconsin, as signified by the tight gradient stretching into Iowa. There is also a large gradient, but not as intense over Wisconsin into Michigan helping to show where the moisture is surging into. The gradients match up well with the temperatures and help pinpoint the location of the cold and warm fronts. Dewpoint temperatures are 77°F in Madison and could be estimated to be the same in Oakfield.
21Z Pressures Uncontoured : 21Z Pressures
There was some concern at 18Z about the 1000.8mb pressure in west-central Wisconsin being valid. At 21Z the pressure remains unchanged at this location. There is a 1000.0mb pressure to the north of it so the reading may be valid, though it is unlikely that the pressure would remain unchanged over 3 hours. This pressure will continue to be contoured as if it was valid. The system has moved to the the southeast and is centered over western Wisconsin. The large gradient in pressures occurs over the southwest corner of the cyclone. This southwest corner corresponds nicely with the anticipated locations of the cold front. The system is quite intense at the surface for a mid-July storm. Satellite imagery shows that storms are firing up along the frontal locations. Pressures in Oakfield can be estimated to be 1005.0mb, still east of the front and center of low pressure.
21Z Winds Unstreamlined : 21Z Winds
The winds continue to show the main moisture flow into Iowa, Wisconsin, and most of the Ohio River Valley. Canadian air can clearly be seen funneling in on the western side of the cyclone. The clashing of streamlines remains the focal focal point for storm development. It exists over southwestern Wisconsin, and northeastern Iowa. Streamlines tend to converge in two locations. One being in northwestern Wisconsin/eastern Minnesota and the other area over Michigan. In addition the influence of the lakes may be affecting the wind field, causing another convergence area. Winds in Oakfield continue to show a good flow of moisture rich air into the area.
23Z August 18th Surface Analysis:
23Z Temperatures Uncontoured : 23Z Temperatures
Temperatures have remained fairly constant over the contoured area. Temperatures have increased slightly in southern Wisconsin as the southwesterly flow advects the slightly warmer temperatures out of Iowa. A more notable change is the cooler Canadian air being funneled down over Minnesota. The large temperature gradient still exists over Wisconsin but hasn't seemed to shifted much over the past few hours. Temperatures in Oakfield are likely to be 86°F.
23Z Dewpoint Temperatures Uncontoured : 23Z Dewpoint Temperatures
Dewpoints continue to slightly increase over most of southern Wisconsin. The most notable change is the influx of dryer air in the northwest corner of Wisconsin. The 70°F contour has shifted a large distance toward the center of the state in conjunction with the approaching cold front moving rapidly toward the Oakfield area. The main storm development area is still slightly west of Oakfield, though it appears storms could be developing at any time. Analysis of the wind field, along with satellite and Doppler radar depicts a more clear picture of where the main activity is located. Dewpoints in Oakfield are likely around 78°F, a very sticky and uncomfortable temperature.
23Z Pressures Uncontoured : 23Z Pressures
The isobar analysis continues to show the center of the storm to be over Wisconsin. The low pressure is now 1000.8mb over the same location where it hasn't changed for the past five hours. I'm convinced it's an error. This is the last time this location will be contoured. It will be crossed off and be considered an error. The central pressure at 21Z was 1000.0mb. It can be anticipated there may still be a central pressure close to that in the area, though it may not be located near a recording station. The system is moving eastward, as indicated by the falling pressures over the eastern portions of Wisconsin. The largest gradients occur through the Oakfield and Madison areas. The estimated pressure in Oakfield is 1004mb. It is difficult to tell whether the center of the cyclone has shifted east of Oakfield.
23Z Winds Unstreamlined : 23Z Winds
The main convergence of wind, indicated by the streamlines, seems to be right over the Oakfield area while stretching southwestward into Iowa. This surface convergence shows if storms are going to develop they could begin any time, while those that have developed should be moving into the area or over the area anytime. This is where analyzing the Doppler radar and satellite images would be vital in knowing storm locations. Streamlines indicate moist air is continuing to be pumped into Oakfield, though it won't be long before the winds shift direction, favoring the cooler and drier air from Canada.
00Z August 19th Surface Analysis:
00Z Temperatures Uncontoured : 00Z Temperatures
Temperatures have remained fairly constant over the past hour, only decreasing a few degrees in most locations. It's 7:00 PM over the area and the sun is beginning to set, allowing temperatures to begin their downward descent. The gradients haven't shifted much compared to the 23Z analysis. Temperatures in Oakfield are close to 87°F, though with the approaching storm temperatures can quickly drop 20°F.
00Z Dewpoint Temperatures Uncontoured : 00Z Dewpoint Temperatures
The 70°F contour continues to make it's way right toward the Oakfield area. The large gradient of the 78°F and 66°F dewpoints in central Wisconsin indicate the location of the cold front. Storms have developed out in front of the cold front moving east/southeast. Oakfield is right in the path of a dangerous supercell. The supercellular thunderstorm is just to the northwest of the Oakfield area when the tornado begins its development. Radar and satellite imagery show the storms right over the area, as the two air masses do battle.
00Z Pressures Uncontoured : 00Z Pressures
The center of low pressure is now likely over Lake Michigan as the surface pressures over western Wisconsin have began to rise back up above 1004.0mb. With a center of pressure over Michigan the front would likely be draped right over the Oakfield area. There is a large gap in data between western Wisconsin and central Michigan, making an estimated guess on whether the system is weakening or strengthening difficult, though it does appear to be weakening as the minimum contours are slightly higher than the past hour. The center of the low has passed Oakfield just to the north but came close enough to provide enough lift to maintain and help initiate the powerful thunderstorms.
00Z Winds Unstreamlined : 00Z Winds
The streamline analysis does indeed indicate the center of the low is over Lake Michigan. The area of convergence continues to be right over the Oakfield area. Storms are erupting along this converging line producing heavy rain, hail, dangerous lightning, and tornadoes. The supercell is minutes from releasing it's fury over the Oakfield area. The tornado stays on the ground for over 20 minutes as is moves southeast over Wisconsin. The tornado doesn't stay at F5 status for the entire time as it oscillates in intensity as it moves. The tornado was at it's maximum strength as it moved into and out of the Oakfield area.
01Z August 19th Surface Analysis:
01Z Temperatures Uncontoured : 01 Temperatures
The tornado has died, but intense thunderstorms continue to roar across southcentral sections of Wisconsin. The Oakfield supercell has weakened while merging with a larger thunderstorm complex located just to the northwest. The large thunderstorm complex did produce a few tornadoes, but they were very weak compared to the Oakfield tornado. The 73°F temperature in eastern Wisconsin is 8°F cooler than an hour ago. Thunderstorm activity was able to significantly cool off many of the eastern Wisconsin locations. The temperature in Madison, WI has not changed much at all. In fact the city was in between thunderstorm complexes, which helps explain why it didn't cool off rapidly. The air is still warm and sticky at this time but will gradually begin to cool and dry out as the evening persists. With the sun setting the thunderstorm activity will begin to die as the heat source is gone, stabilizing the atmosphere.
01Z Dewpoint Temperatures Uncontoured : 01Z Dewpoint Temperatures
The dewpoint temperature in Madison remains unchanged after the storms pass to the northeast of the city. The major difference is the dewpoints have cooled into the 60's over central and northeastern Wisconsin, down almost 5°F from an hour ago. The cold front is situated over Green Bay, WI and extends to the southwest corner of the state, as denoted by moisture gradients and streamlines. The gradient is still draped across southern Wisconsin as more storms may still develop or persist. Once again satellite and radar imagery is vital to locating where the thunderstorm activity is and in predicting where new storms may develop. The main thunderstorm activity seems to have passed to the south and east of Oakfield.
01Z Pressures Uncontoured : 01Z Pressures
Pressures are rising in western Wisconsin but have changed in both directions in eastern Wisconsin, though it appears the low pressure is still located over central Lake Michigan. The lack of station data over Lake Michigan and western Michigan make exact minimum location difficult, though it appears the system continues to move east. The streamline analysis should help pinpoint the cyclone center. With the cyclone continuing to move east, the threat of storms moves east as well.
01Z Winds Unstreamlined : 01Z Winds
The streamline analysis shows the cyclone center exists in the data void region over Lake Michigan and western Michigan. The Oakfield area is just to the west of the convergence line, as it has also moved south and is draped over the Madison area. The flow is beautiful in showing a classic cyclone streamline setup. Southward flowing cooler and drier air clashing with northward warm and moist air, all converging at the center of low pressure. The fronts are easily identified by the streamline analysis as the cold front is across southern Wisconsin and central Iowa. The warm front extends into Canada above northern Michigan.