1-minute GOES-18 imagery to monitor the potential of flash flooding in American Samoa
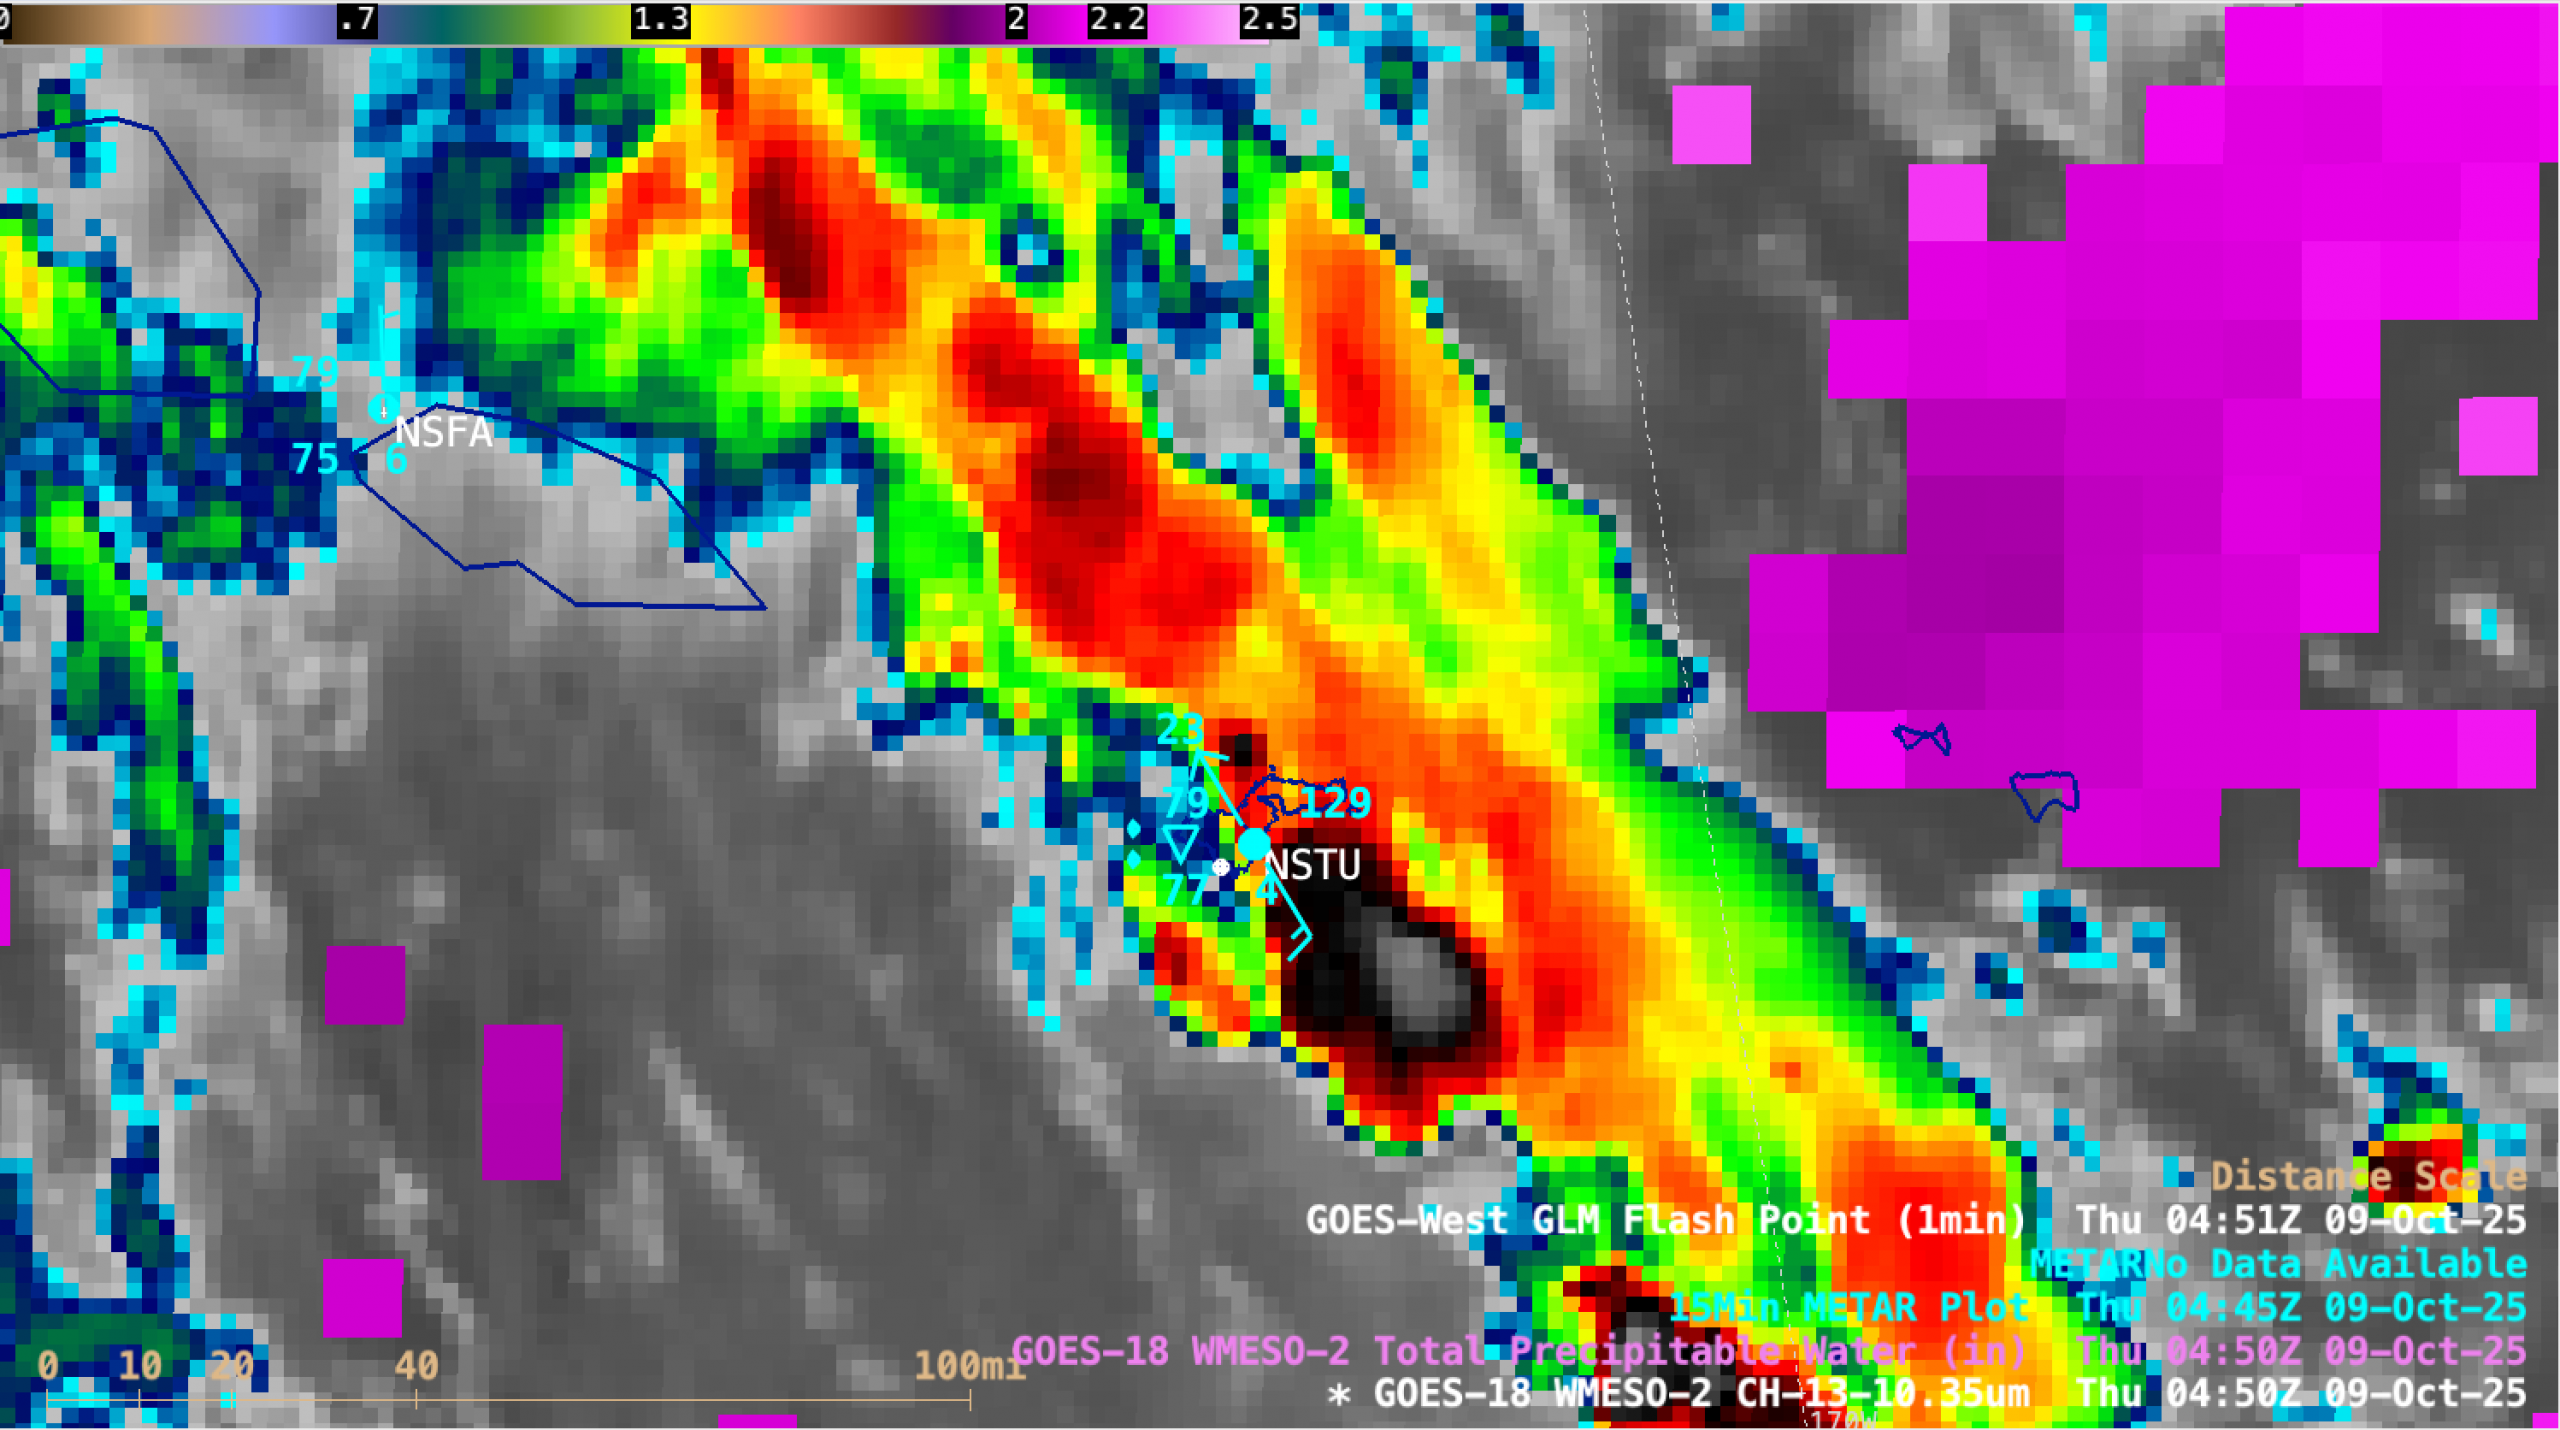
Due to a lack of radar coverage over American Samoa, WSO Pago Pago requested a 1-minute Mesoscale Domain Sector over the islands to monitor convective development and the potential for flash flooding. GOES-18 (GOES-West) Clean Infrared Window (10.3 µm) images (above) showed rain showers that developed in the general vicinity of the American Samoa island... Read More


