GOES Launch Pad Listing over the Decades
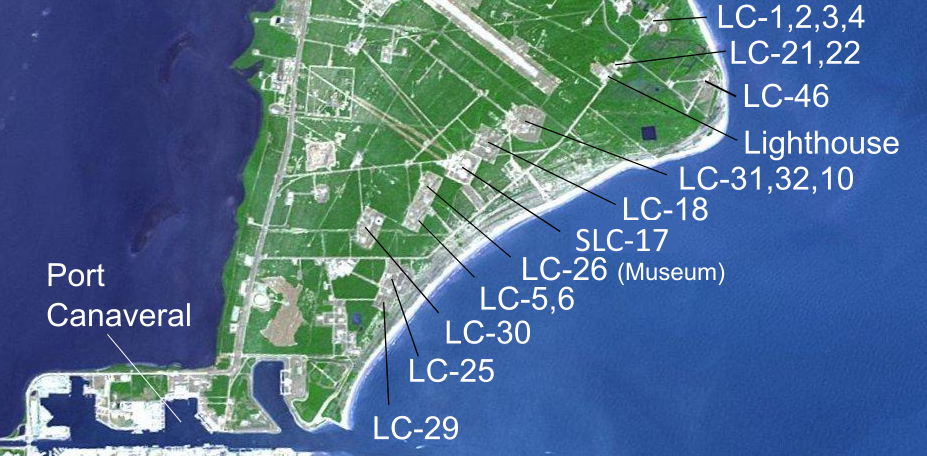
The above wiki image is credited to : “Mark Wade 2003 (text) NASA/GSFC/METI/ERSDAC/JAROS, and U.S./Japan ASTER Science Team 2006-09-01 (photo) Borrow-188 and Soumya-8974 (compilation) – This file was derived from: CCAFS.jpg.All the GOES launches have been from Cape Canaveral (FL), but the launch pads used have varied over the decades.... Read More