Panels, Policies and Protocols
continued
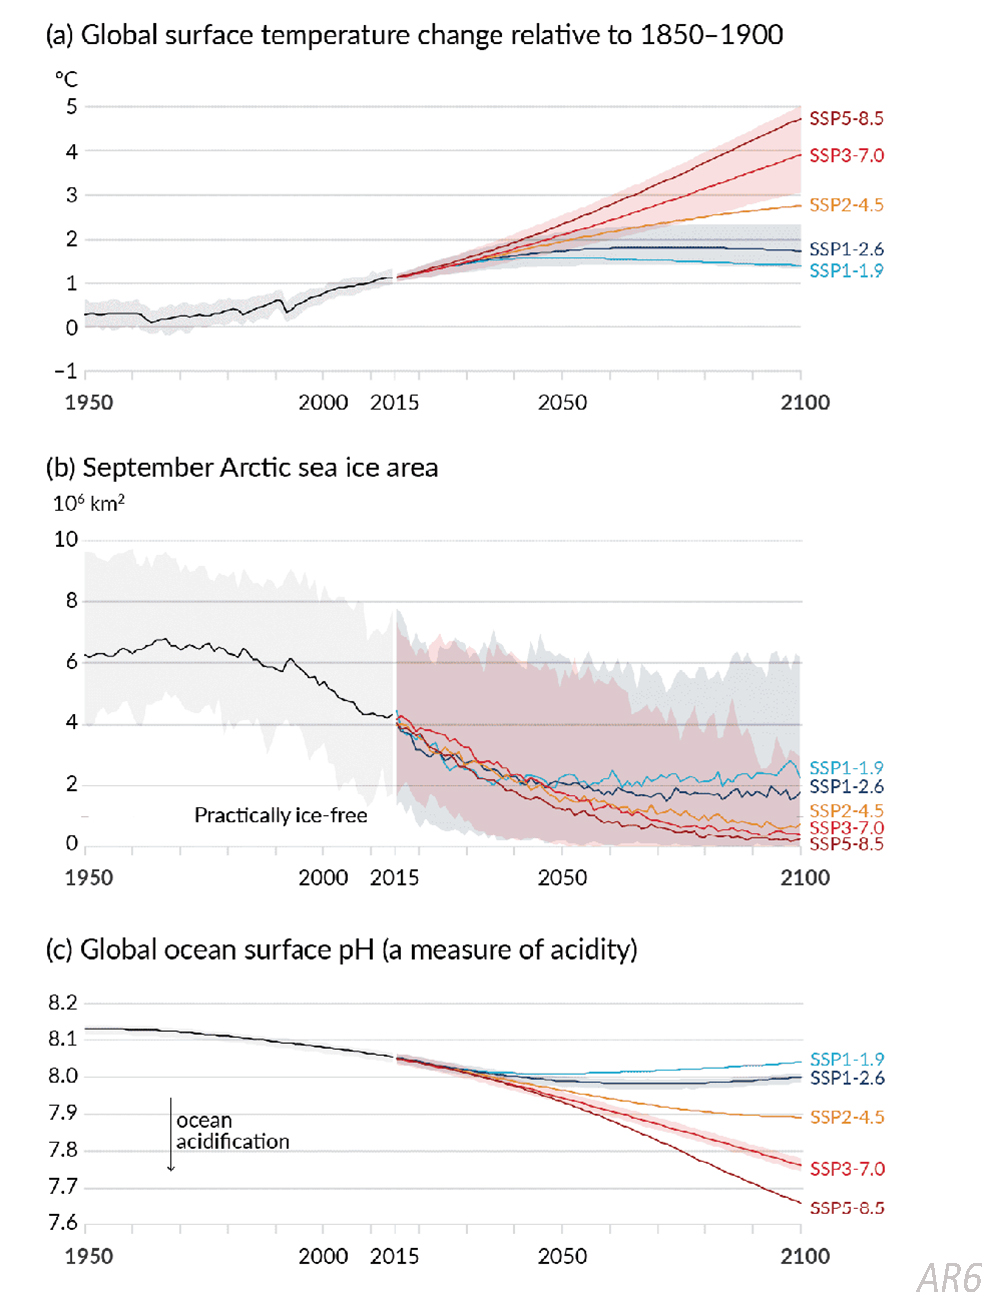
The IPCC Sixth Assessment (AR6)
These 3 graphs are from the Sixth IPCC Report (AR6) with observed data on temperatures, sea ice and ocean acidity through 2015 followed by projected changes through the end of the century. The projections are based on 5 different scenarios called Shared Socio-economic Pathways (SSPs). The five scenarios (SSP1-1.9, SSP1-2.6, SSP2-4.5, SSP3-7.0, and SSP5-8.5. I) reflect choices society makes related to fossil fuels and carbon footprint.