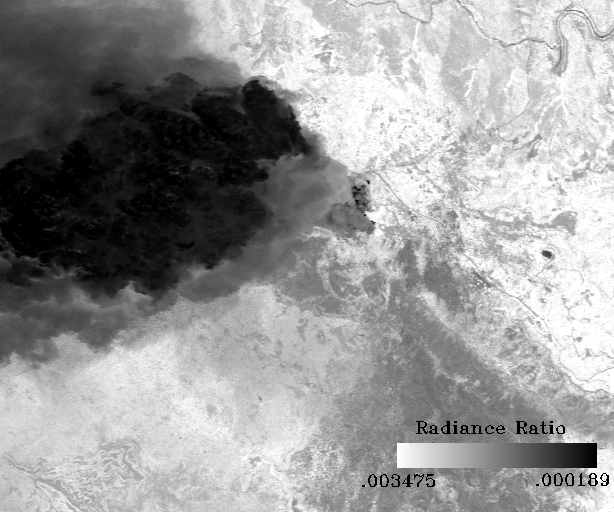
Above is a ratio image of the Out-of-Band to the In-Band.
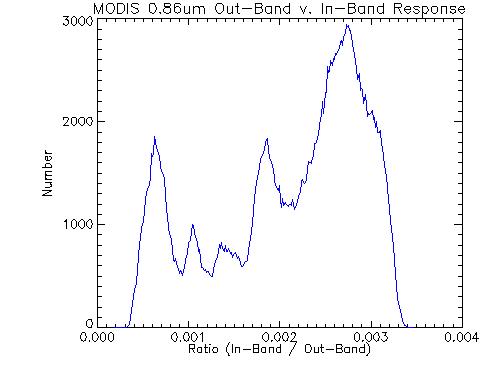
Above is a histogram of the ratio of the MODIS 0.86um Out-of-Band response to In-Band response. The maximum ratio value is .0035 and the minimum ratio value is .0002.
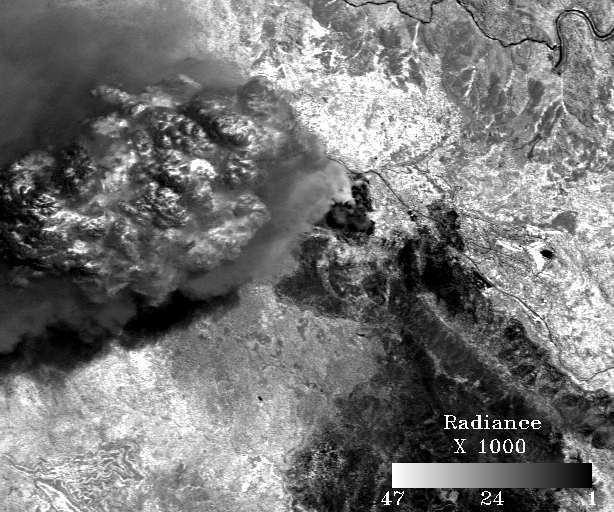
Above is a difference image between the Out-Band + In-band and the In-Band.
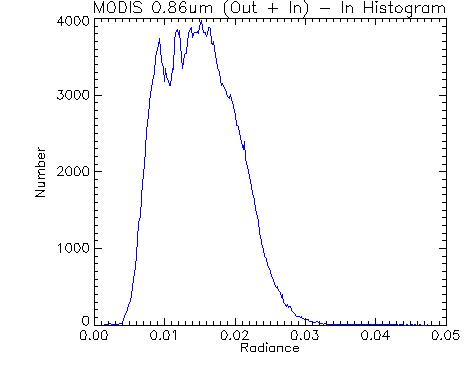
Above is a histogram of the Out-Band + In-Band minus In-Band image.