
Steve Ackerman
Brent Maddux
Richard Frey
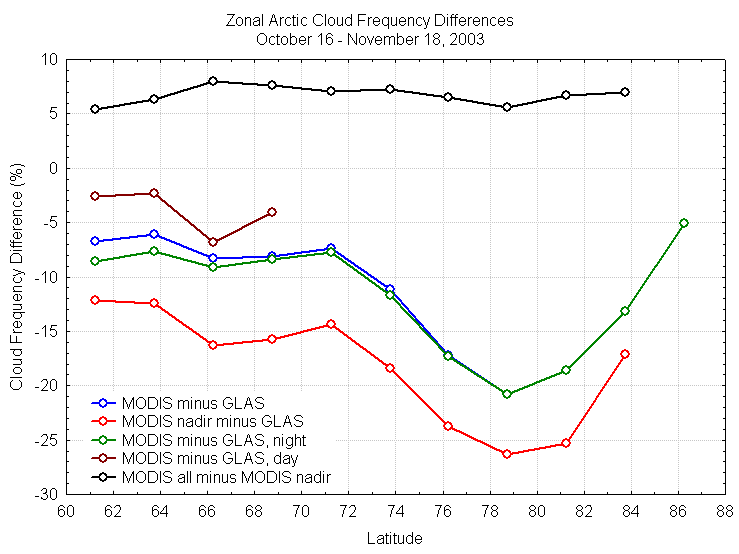
MODIS and GLAS cloud fraction differences; note that north of about 76 degrees latitude “all” and “night” categories are the same due to the season. Nadir MODIS data i s day and night combined.
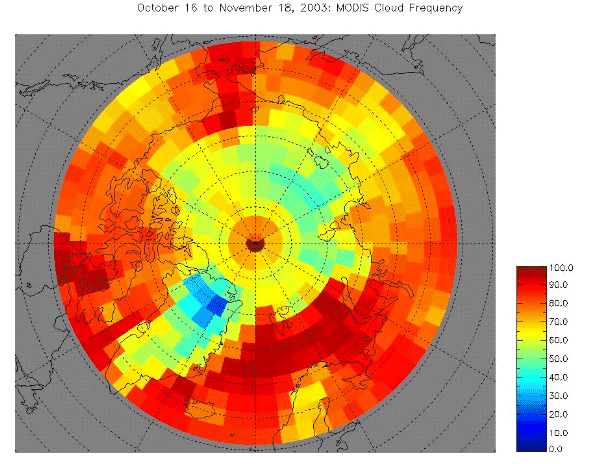
MODIS Terra Collection 5 cloud frequency from 60-90 N. Area near the north pole is biased high due to there being no near-nadir views there.
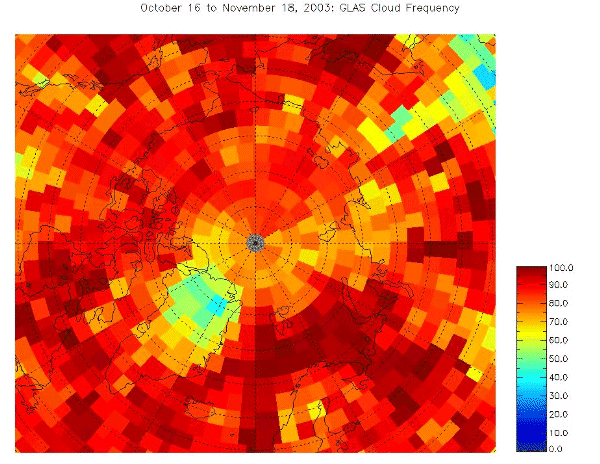
GLAS medium-resolution (one value per second) cloud frequency. In contrast to MODIS, note the nearly continuous high cloud fractions across the central Arctic Ocean. Still, common patterns of relative high and low cloud fraction are seen over Northern Greenland, Hudson Bay, Foxe Basin, Bering Straight, north central Siberia, and the Greenland, Norwegian, and Barents Seas.
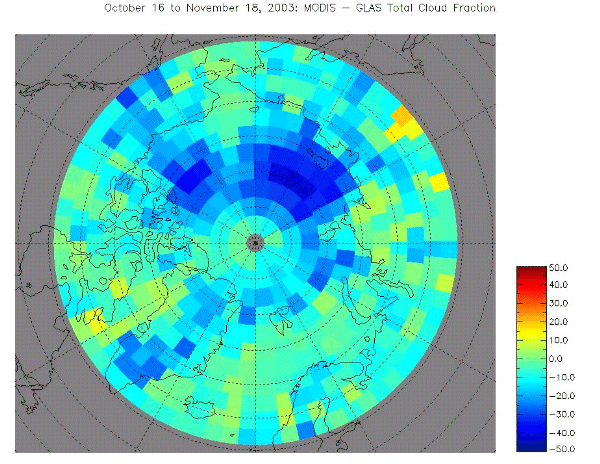
MODIS minus GLAS cloud frequency. The very sensitive GLAS “sees” more clouds almost everywhere especially over the Arctic Ocean and Greenland ice where reduced visible and thermal contrast make cloud detection more difficult for passive instruments like MODIS.
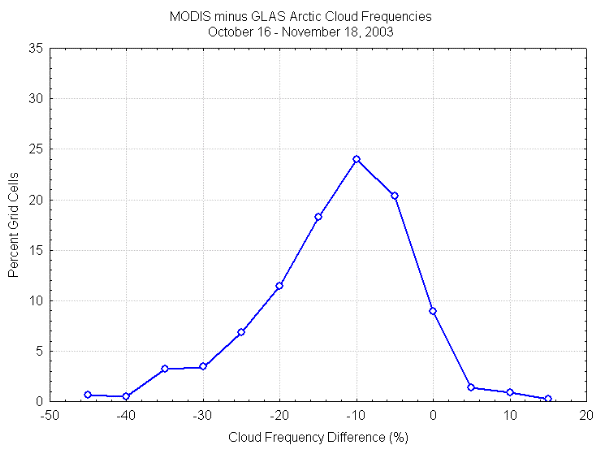
Distribution of MODIS minus GLAS cloud fractions in 2.5-degree equal area grid cells. Mode is -10%.
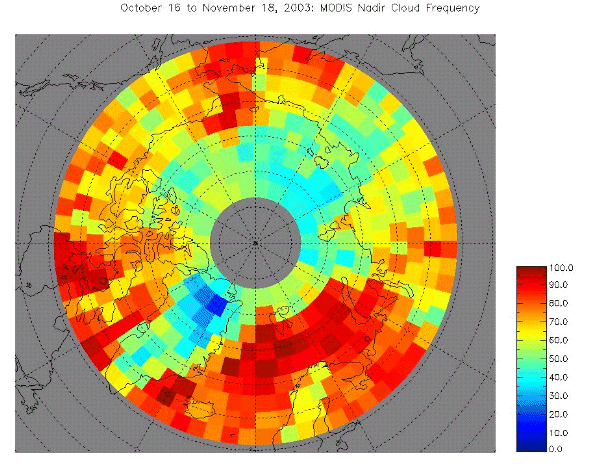
MODIS cloud frequency for nadir views only (middle two pixels of each scan line). Cloud fractions are generally lower than when all pixels are included.
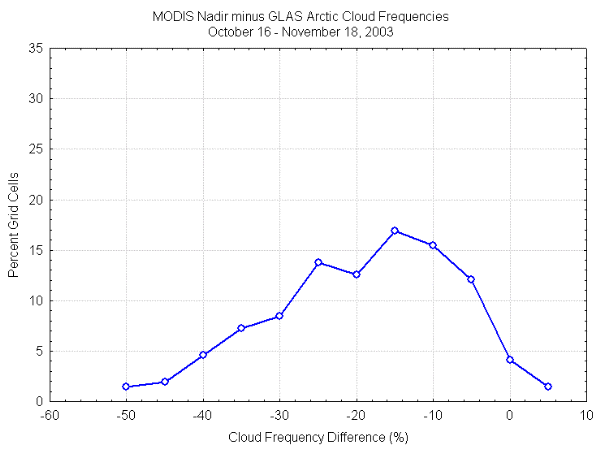
Distribution of differences between MODIS nadir and GLAS cloud fractions in 2.5-degree equal-area grid cells. The mode is -15 %. Distribution is skewed more toward negative differences in comparison to the previous histogram.
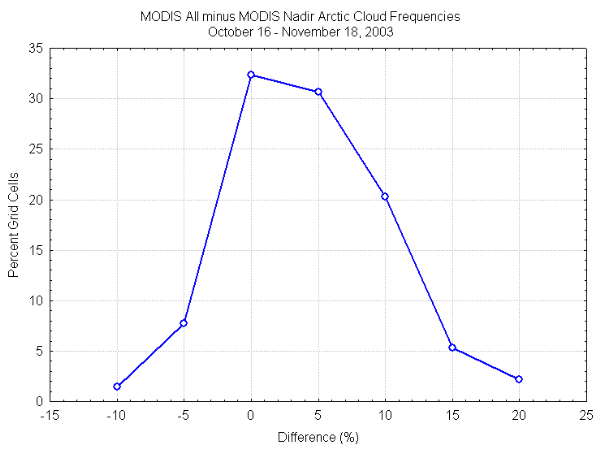
Distribution of MODIS cloud fraction differences between all pixels and near-nadir views only in 2.5-degree equal-angle grid cells.