
7
Weather Forecasting
A California Case Study - IV
Here are two visible images with surface weather observations plotted on them. Can you see the frontal passage?
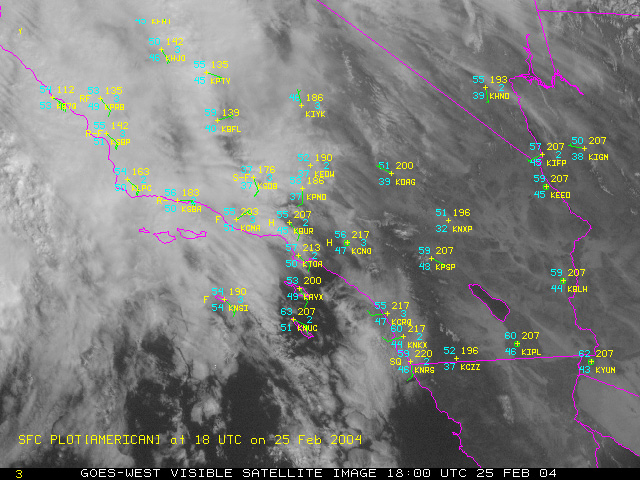 [1] |
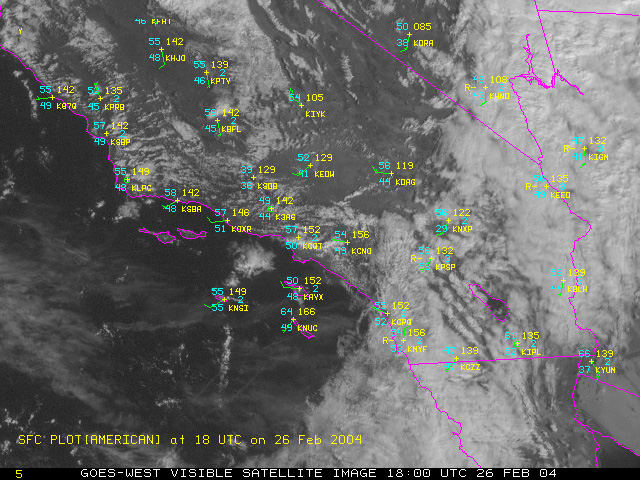 [2] |
Below is a loop of this data. You can see more details by zooming into the image (click ZOOM button, then point & left click on the image to zoom in; right click on the image to zoom out). You can also move the center of your image with your cursor (left click, hold & drag). Play around, this is a fun way to analyze a weather map!
| 10 / 12 |