This website works best with a newer web browser such as Chrome, Firefox, Safari or Microsoft Edge. Internet Explorer is not supported by this website.

Outbreak of tornadoes across North Dakota

1-minute Mesoscale Domain Sector GOES-19 (GOES-East) Visible and Infrared images (above) included time-matched (+/- 3 minutes) plots of SPC Storm Reports — which showed supercell thunderstorms that produced a south-to-north oriented swath of at least 12 tornadoes across central North Dakota on 14 September 2025. With this outbreak, a new record was set for the number of... Read More

1-minute GOES-19 “Red” Visible (0.64 µm, left) and “Clean” Infrared Window (10.3 µm, right) images with time-matched (+/- 3 minutes) SPC Storm Reports plotted in red/blue, from 1730 UTC on 14 September to 0022 UTC on 15 September [click to play animated GIF | MP4]

1-minute Mesoscale Domain Sector GOES-19 (GOES-East) Visible and Infrared images (above) included time-matched (+/- 3 minutes) plots of SPC Storm Reports — which showed supercell thunderstorms that produced a south-to-north oriented swath of at least 12 tornadoes across central North Dakota on 14 September 2025. With this outbreak, a new record was set for the number of tornadoes in North Dakota during a calendar year.

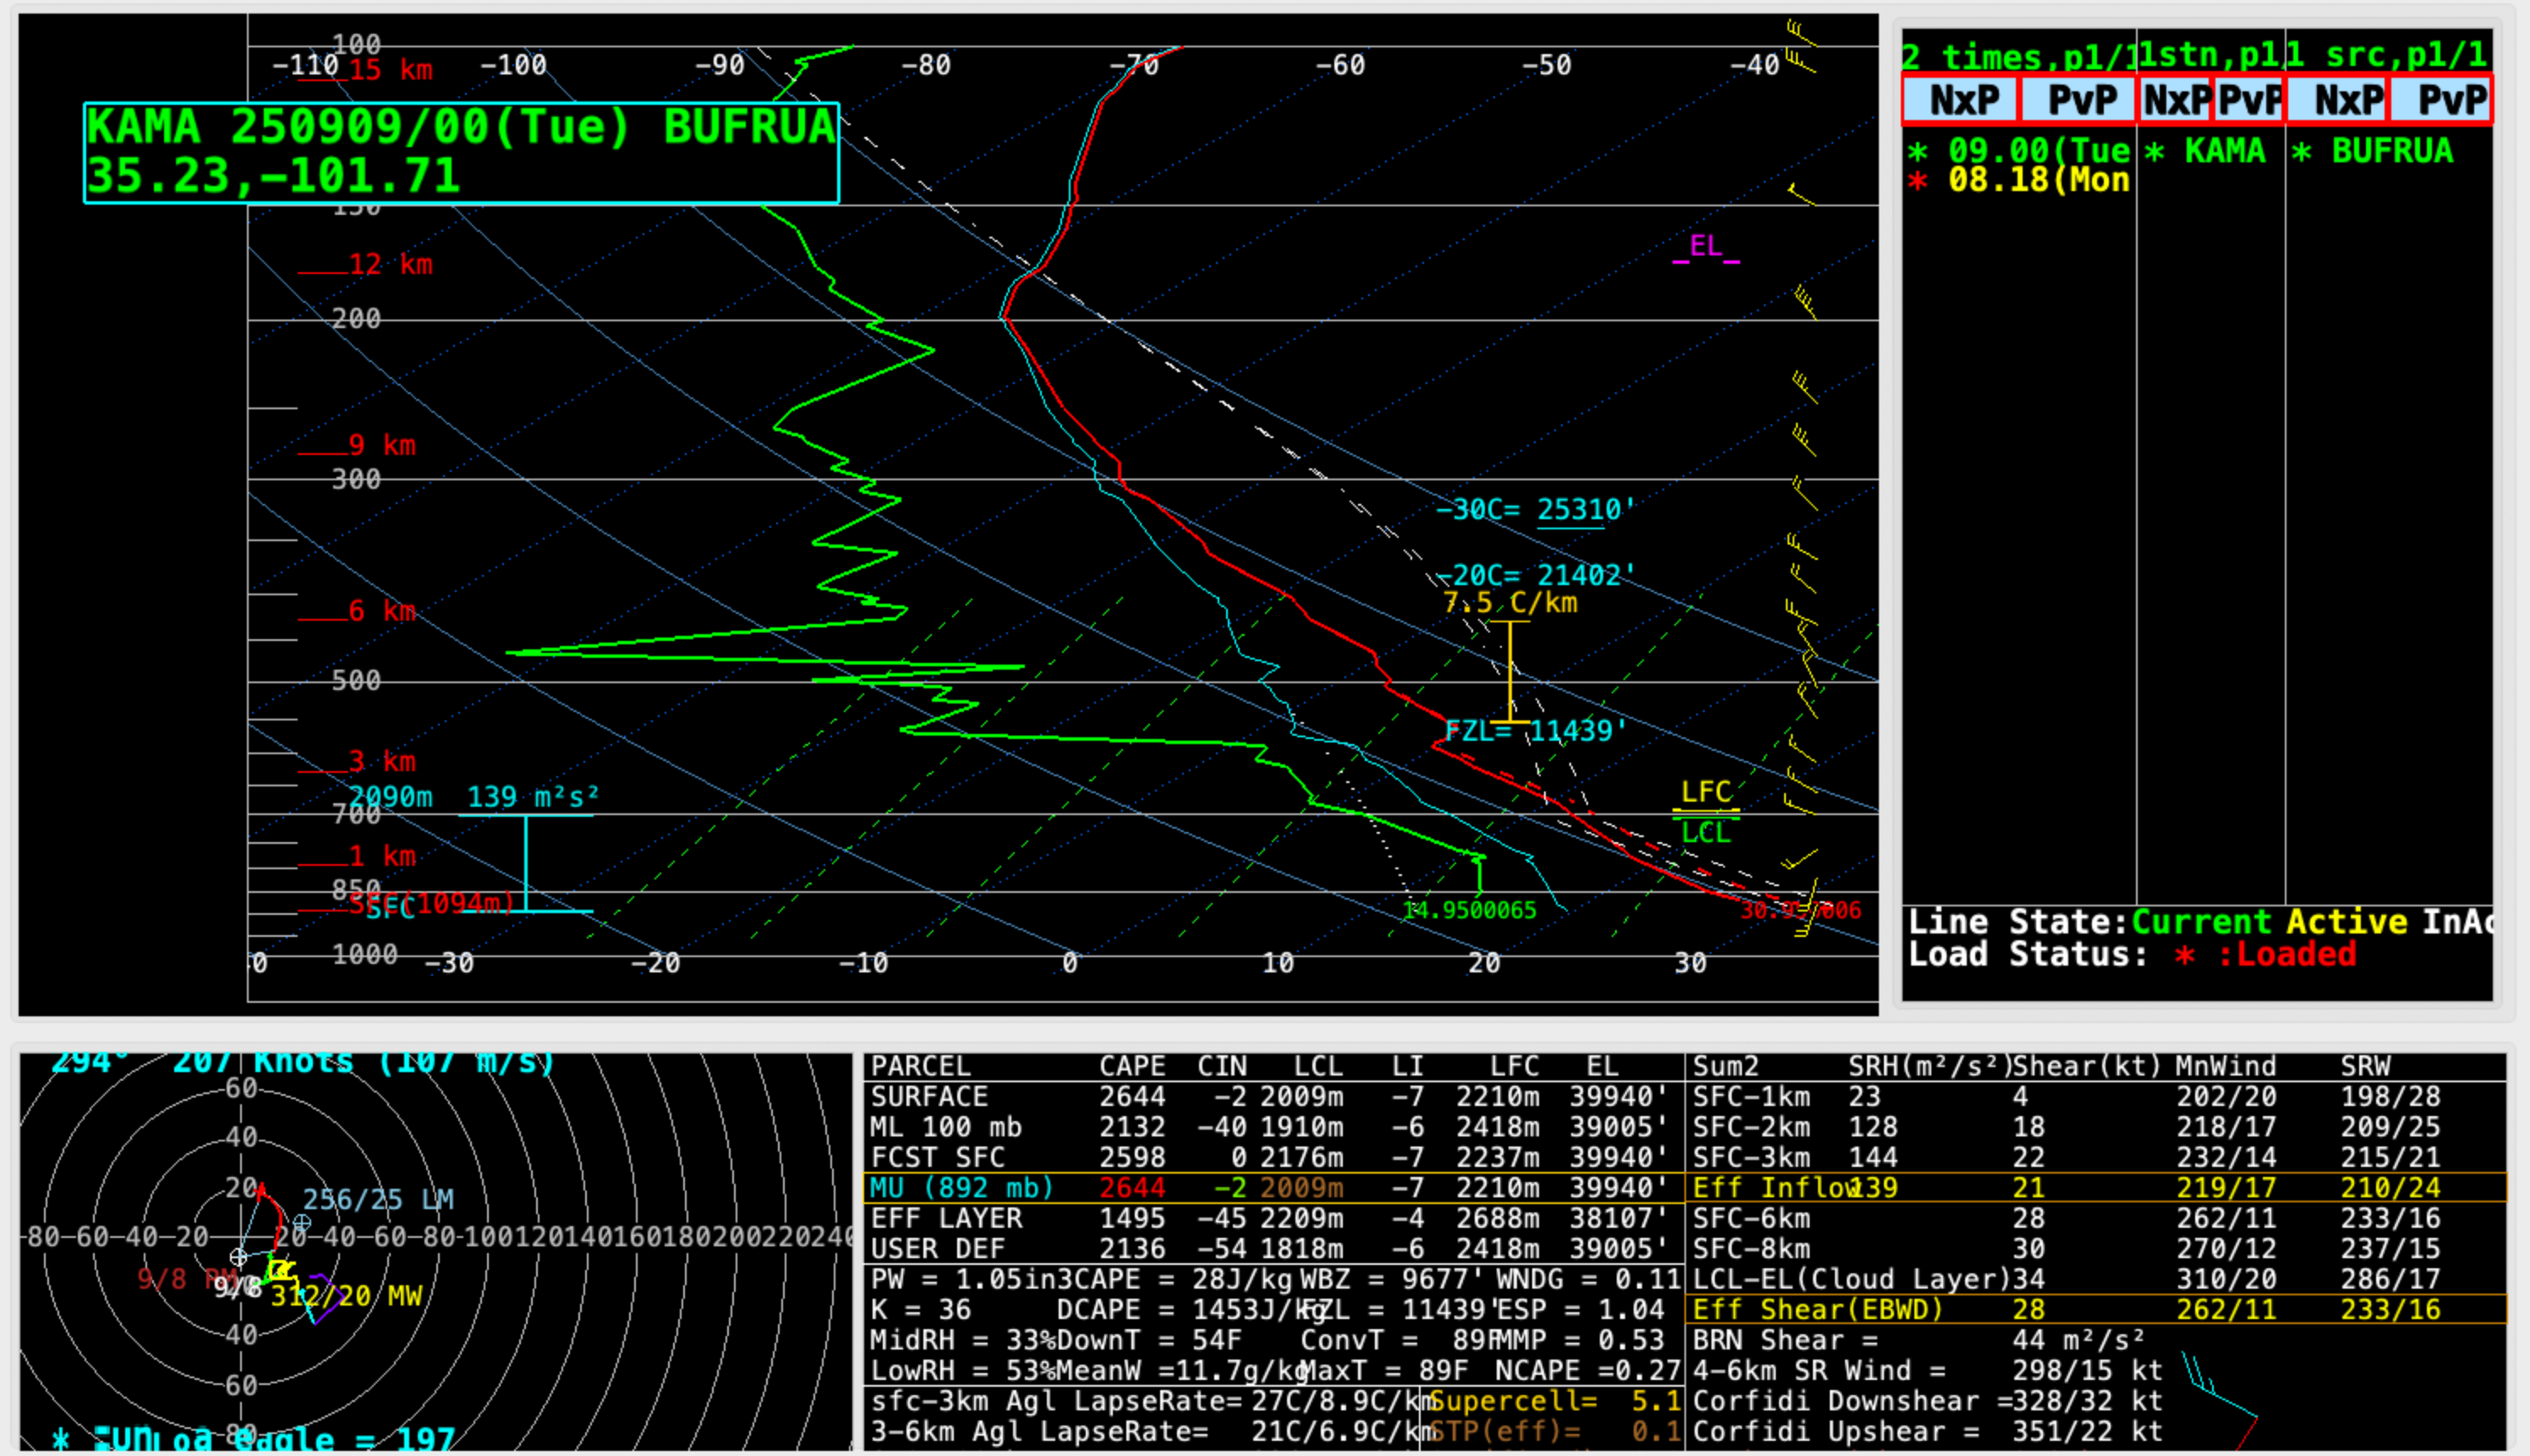
A plot of rawinsonde data from Bismarck, North Dakota at 1800 UTC on 14 September (below) indicated that the Most Unstable (MU) air parcel’s Equilibrium Level (EL) was at an altitude near 12 km, where the air temperature was around -55C (which closely corresponded to the coldest cloud-top infrared brightness temperatures seen in GOES-19 Infrared imagery).

Plot of rawinsonde data from Bismarck, North Dakota at 1800 UTC on 14 September [click to enlarge]

GOES-19 Visible and Infrared images at 2231 UTC (below) included plots of three SPC tornado reports (T) that were received very near that time — plotted at both their observed surface locations, and at their “parallax-corrected” location (assuming a mean cloud-top height of 12 km). It can be seen that that the parallax-corrected locations were moved NW, closer to the parent supercell thunderstorms.

GOES-19 Visible (left) and Infrared (right) images at 2231 UTC on 14 September, with SPC Storm Reports of three tornadoes plotted at their surface locations as well as at their “parallax-corrected” cloud-top locations [click to enlarge]

Another important ingredient helping to produce this tornado outbreak was the presence of climatologically high values of Precipitable Water (below) — the value of 1.39 inch derived from 1800 UTC Bismarck rawinsonde data was above the 90th percentile for 14 September, and not far below the daily maximum value of 1.68 inch.

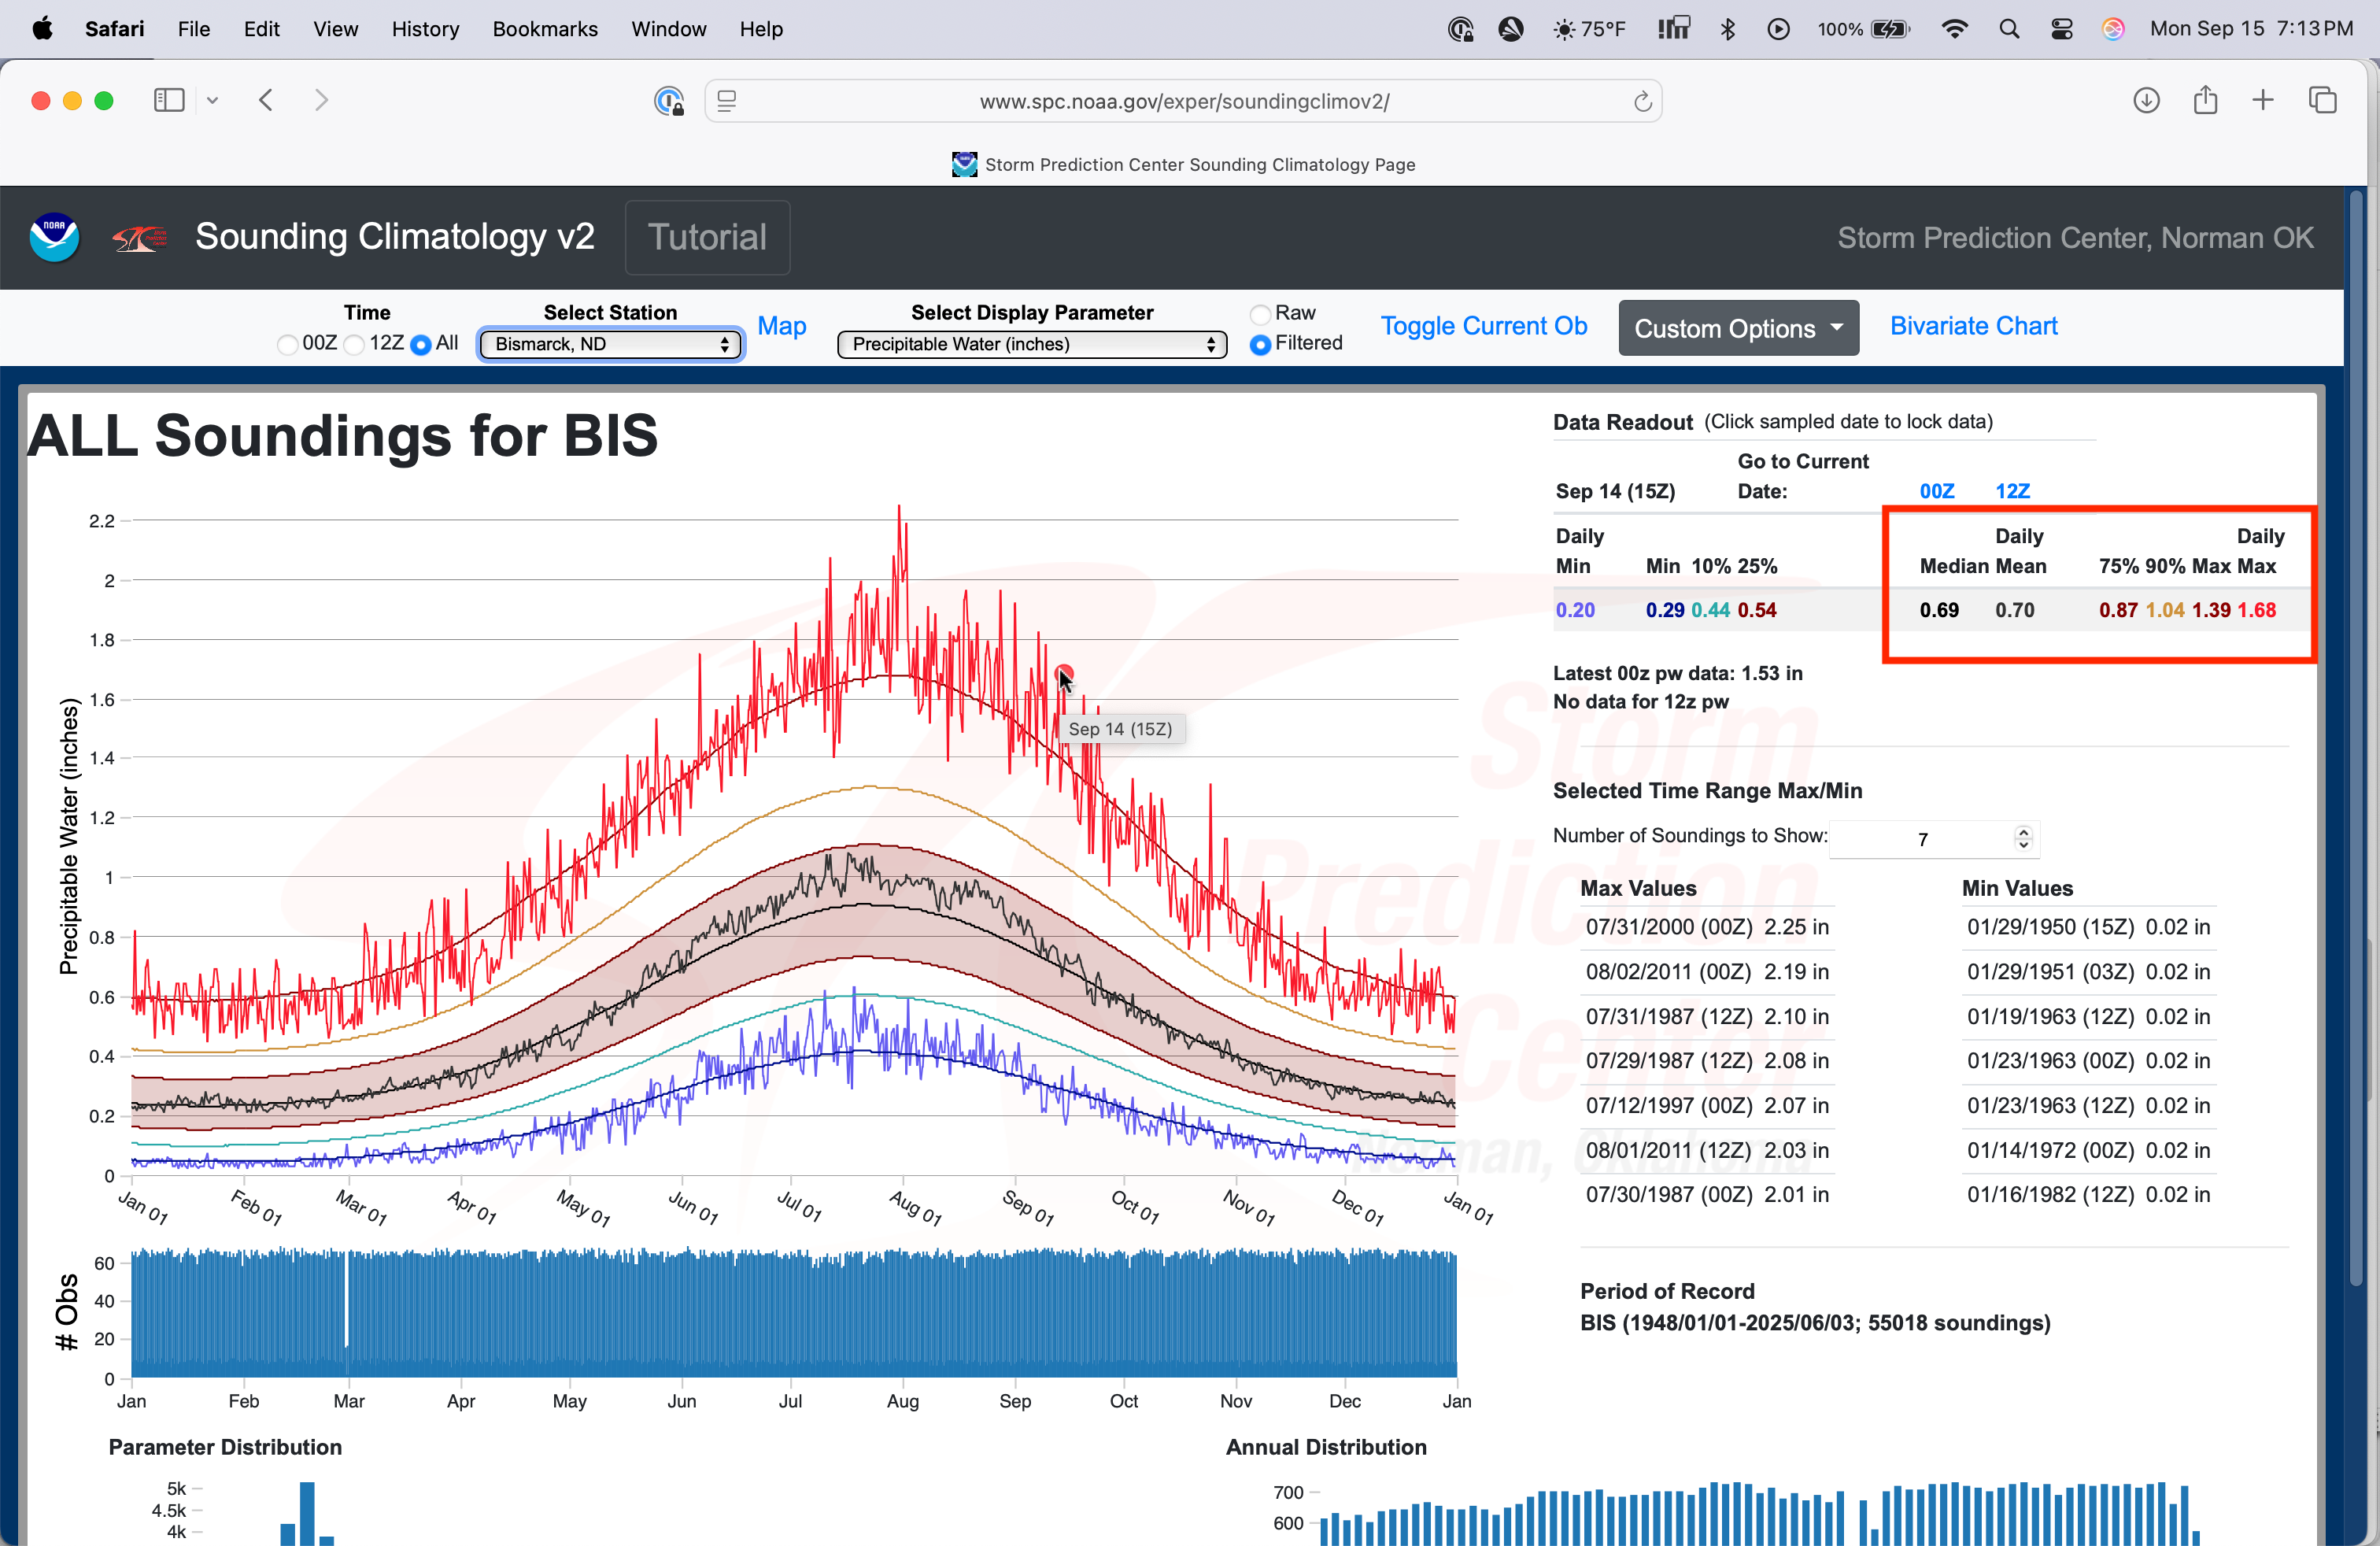
Plot of annual Precipitable Water climatology for all Bismarck soundings — with the values for 14 September highlighted [click to enlarge]

Hourly SPC Mesoscale Analyses of Precipitable Water (below) depicted the broad corridor of high moisture that was being transported northward across the Dakotas on 14 September.

Hourly SPC Mesoscale Analysis of Precipitable Water across the north-central US, from 1500 UTC on 14 September to 0000 UTC on 15 September [click to play MP4 animation]

View only this post Read Less

Post-Tropical Cyclone Kiko north of Hawai’i

5-minute CONUS Sector GOES-18 (GOES-West) Infrared images (above) revealed the exposed low-level circulation center (LLCC) of Tropical Storm Kiko as the system continued to weaken north of the Hawaiian island of Oahu, and downgraded to a Post-Tropical Cyclone at 1500 UTC on 10 September 2025. Clusters of deep convection developed north... Read More

5-minute GOES-18 “Clean” Infrared Window (10.3 µm) images with an overlay of GLM Flash Extent Density, from 0901 UTC on 10 September to 0001 UTC on 11 September [click to play MP4 animation]

5-minute CONUS Sector GOES-18 (GOES-West) Infrared images (above) revealed the exposed low-level circulation center (LLCC) of Tropical Storm Kiko as the system continued to weaken north of the Hawaiian island of Oahu, and downgraded to a Post-Tropical Cyclone at 1500 UTC on 10 September 2025. Clusters of deep convection developed north of the LLCC after 1400 UTC, which exhibited abundant satellite-detected lightning activity. Note that the LLCC passed just to the east of a semi-stationary yellow ship report around 1301 UTC — that was the RV Kilo Moana (Maritime call sign WDA7827), an oceanographic research vessel.

A comparison of GOES-18 Infrared and Visible images (below) showed that the LLCC was more distinct in the higher spatial resolution Visible imagery — however, the LLCC eventually moved beneath the canopy of growing thunderstorms after 1900 UTC, making it impossible to further track.

5-minute GOES-18 “Clean” Infrared Window (10.3 µm, left) and “Red” Visible (0.64 µm, right) images, from 1621 UTC on 10 September to 0001 UTC on 11 September [click to play MP4 animation]

The LLCC was also very apparent in GCOM-W1 AMSR2 Microwave imagery (source) not far north-northeast of Oahu at 1150 UTC (below).

GCOM-W1 AMSR2 Microwave (36.5 GHz) image at 1150 UTC on 10 September [click to enlarge]

ASCAT surface scatterometer winds (source) from Metop-B (at 0735 UTC, when Kiko was still a Tropical Storm) and Metop-C (at 2051 UTC, about 6 hours after Kiko was downgraded to a Post-Tropical Cyclone) are shown below. The depiction of the LLCC wind field was seen to degrade during the ~13 hour period between the two ASCAT images.

ASCAT winds from Metop-B (at 0735 UTC) and Metop-C (at 2051 UTC) on 10 September

View only this post Read Less

A Foggy Morning for Lake Superior

The Great Lakes have a significant amount of thermal mass, meaning it takes a long time for them to cool down as the seasons change from summer to autumn. Often during this time of year, the air overlying the lakes is warmer than the lakes themselves. As water evaporates from... Read More

The Great Lakes have a significant amount of thermal mass, meaning it takes a long time for them to cool down as the seasons change from summer to autumn. Often during this time of year, the air overlying the lakes is warmer than the lakes themselves. As water evaporates from the lake surface into the cold, dry air above, it quickly condenses into fog. GOES-19 and the NOAA Buoy Network can work together to identify such an event.

NOAA’s buoys are preimarily intended to measure waves and winds, but many of them have air and water temperatures as well. Here’s a time series of the recent air and water temperature observations from NOAA’s West Superior buoy, located in the middle of western Superior about 30 miles northeast of the Apostle Islands. Here, it is clear that since about 0500 UTC (midnight local time) on 10 September, the water temperature has been at or above the air temperature.

This is a clear recipe for fog as the unsaturated air quickly becomes overwhelmed with moisture that has evaporated from the lake. The buoy itself can confirm this, as it has a system of cameras that show an up close and personal view of conditions at that site.

Of course, there are only a handful of buoys in the otherwise vast expanse of Lake Superior. Most of the lake has no in situ information at all. This is yet another case where satellites can be useful. However, satellite observations of fog can be challenging, especially when relying on the infrared band. This is because fog is such a low cloud that its brightness temperature is effectively the same as the land. Take, for example, this view of the Band 13 (10.7 micron) infrared window channel. Clouds are easy to discern over the upper peninsula of Michigan and eastern Wisconsin, but things are much murkier over western Lake Superior. Is the fog uniform across the lake, or are there clearing spots that cannot be seen from this view because the lake and fog temperatures are basically the same?

This is where RGB views can help add significant insight. In the Day Microphysics view (shown here because local time is from 9-10 AM for these loops) it is evident that there is clearing along the Minnesota shore, where the blue of the surface can be clearly discerned by the greyish color of the fog. Such clearing is impossible to discern from the infrared satellite.

SSEC Researcher Kathy Strabala notes that during the portions of the lunar cycle where the moon is providing a lot of illumination, VIIRS can provide visible-like imagery at night that can also aid in fog detection. For this event, the closest full moon was on 7 September, just two days before. The following image from the VIIRS Direct Broadcast antenna at CIMSS Headquarters illustrates the impact of the moon’s light perfectly. Note that even though it is night, it is easy to see where the fog ends. Thanks, Kathy!

____________________

5-minute GOES-19 Day Fog BTD (3.9 µm – 10.3 µm) images with buoy observations plotted in yellow, from 1301-1801 UTC on 10 September (courtesy Scott Bachmeier, CIMSS) [click to play MP4 animation]

GOES-19 Day Fog brightness temperature difference (BTD) images with plots of buoy data (above) revealed that Lake Superior buoy water temperatures were generally in the 52-54 F range, with air temperatures within 1-2 degrees F of the water temperatures.

The corresponding Day Fog BTD images with plots of METAR surface reports (below) helped to explain why the aforementioned gap in the fog off the North Shore of Minnesota began to fill in after about 1501 UTC — this was in response to the development of a lake breeze (note the shoreline-parallel cloud line that formed not far inland, along the leading edge of the lake breeze) as daytime heating progressed across the Arrowhead of Minnesota. This lake breeze then acted to draw the fog edge toward the coast.

5-minute GOES-19 Day Fog BTD (3.9 µm – 10.3 µm) images with METAR surface reports plotted in white, from 1301-1801 UTC on 10 September (courtesy Scott Bachmeier, CIMSS) [click to play MP4 animation]

The GOES-19 Cloud Thickness derived product (below) showed that much of the fog across western Lake Superior was 500-1000 ft thick.

5-minute GOES-19 Cloud Thickness derived product with buoy observations plotted in yellow, from 1401-1801 UTC on 10 September (courtesy Scott Bachmeier, CIMSS) [click to play MP4 animation]

A 30-meter resolution Landsat-8 “Natural Color” RGB image at 1652 UTC (below) displayed the intricate and non-uniform structure of the top of the lake fog layer — and also highlighted the presence of an undular bore east of the Apostle Islands.

Landsat-8 “Natural Color” RGB image at 1652 UTC on 10 September [click to enlarge]

View only this post Read Less

Severe thunderstorms produce giant hail and isolated tornadoes in the Southern Plains

1-minute Mesoscale Domain Sector GOES-19 (GOES-East) Visible and Infrared images (above) included time-matched (+/- 3 minutes) SPC Storm Reports — which showed discrete supercell thunderstorms that produced giant hail (as large as 4.00 inches in diameter in southwest Kansas at 2215 UTC and 2343 UTC, and 3.50 inches in diameter in the northeast Texas Panhandle... Read More

1-minute GOES-19 “Red” Visible (0.64 µm, left) and “Clean” Infrared Window (10.3 µm, right) images with time-matched (+/- 3 minutes) SPC Storm Reports plotted in red/cyan, from 2130 UTC on 08 September to 0030 UTC on 09 September [click to play animated GIF | MP4]

1-minute Mesoscale Domain Sector GOES-19 (GOES-East) Visible and Infrared images (above) included time-matched (+/- 3 minutes) SPC Storm Reports — which showed discrete supercell thunderstorms that produced giant hail (as large as 4.00 inches in diameter in southwest Kansas at 2215 UTC and 2343 UTC, and 3.50 inches in diameter in the northeast Texas Panhandle at 2352 UTC) on 08 September 2025. There were also tornadoes at 2257 UTC in Oklahoma and at 0005 UTC in Texas.

Pulses of overshooting tops exhibited infrared brightness temperatures as cold as -75ºC — which represented a ~2 km overshoot of the Most Unstable (MU) air parcel’s Equilibrium Level (EL), according to 0000 UTC rawinsonde data from Amarillo, Texas (below).

Plot of rawinsonde data from Amarillo, Texas at 0000 UTC on 09 September [click to enlarge]

View only this post Read Less