Comparing Satellite Derived Data over the Pacific Ocean with Buoy Data
Click on each of the images below to view a larger version
This activity allows you to compare satellite and “ground truth” buoy measurements of wind vectors and sea surface temperature off the coast of California in June 2002.
Satellite derived data is shown in the top center with two colorful side-by-side graphics.(click to enlarge) Wind speed is indicated by color and wind direction is shown by arrows; these wind vectors were determined from scatterometer measurements. The adjacent graphic shows ocean currents derived from satellite altimeter measurements superimposed on sea surface AVHRR temperatures.
Note the wind-induced coastal upwelling of cold water.
 |
 |
 |
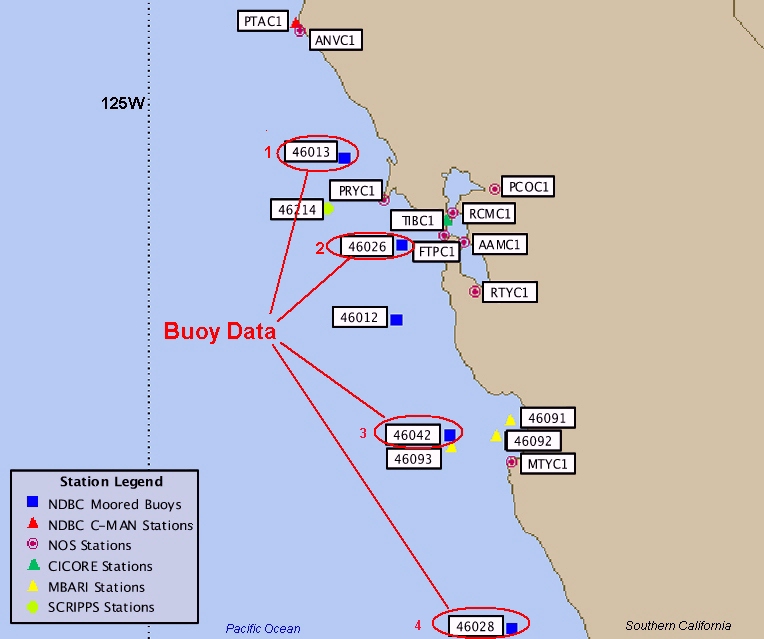
Buoy Locations |
Satellite derived Air & Ocean data |
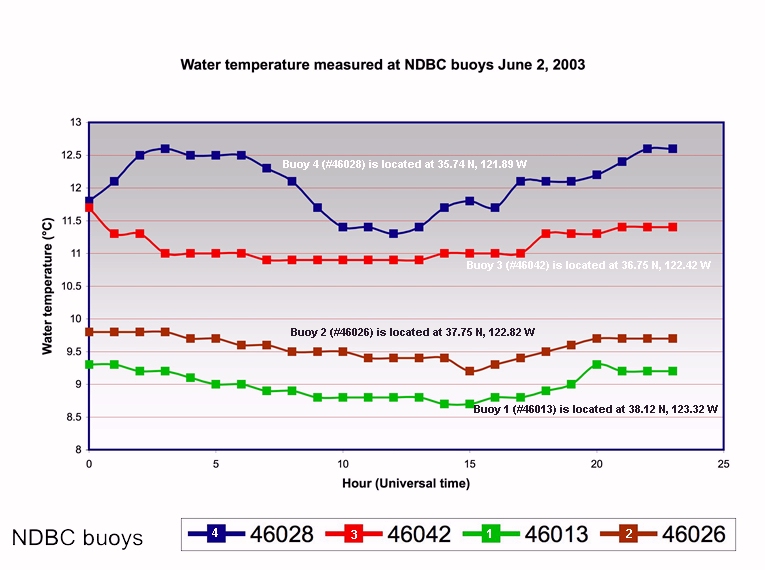
Water Temperature (ground truth from buoys) |
 |
 |
 |
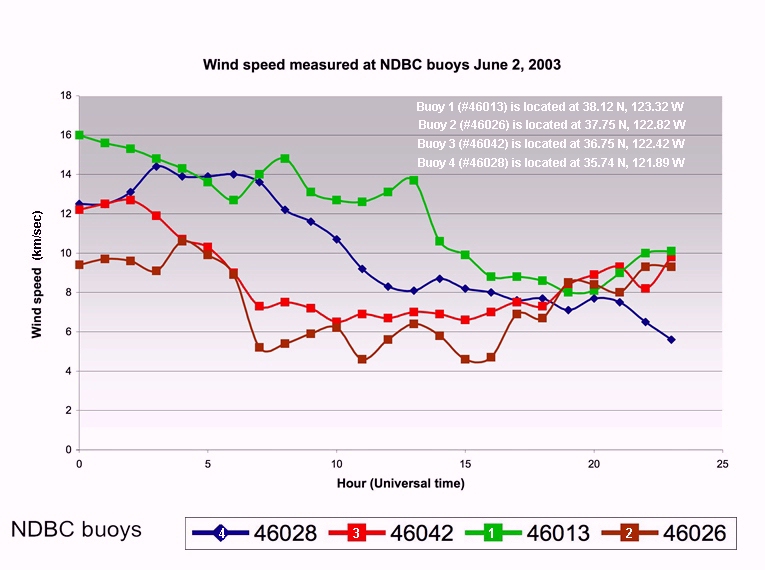
Wind Speed (ground truth from buoys) |
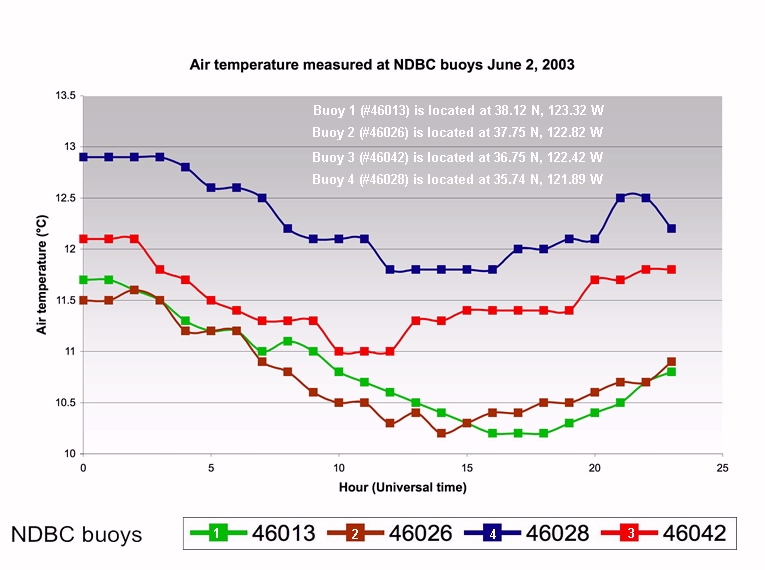
Air temperature (ground truth from buoys) |
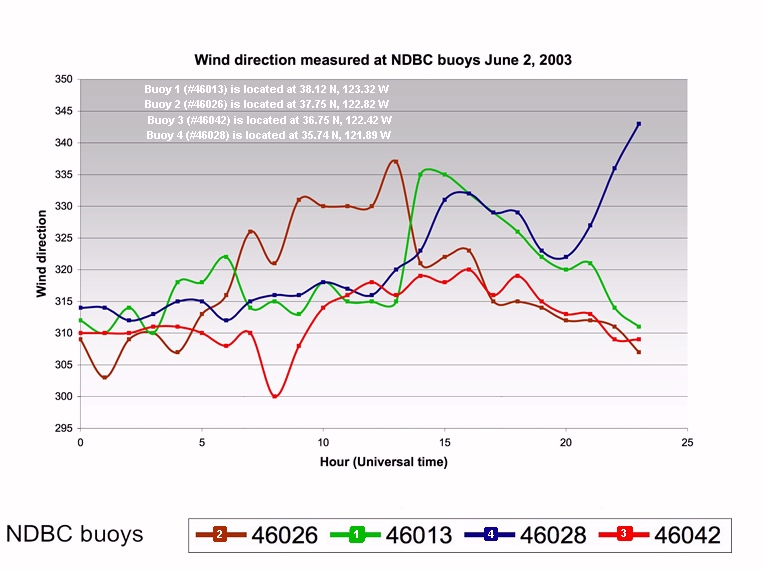
Wind direction (ground truth from buoys) |
The plots summarize hourly measurements of wind direction and wind speed, as well as the air and water temperature measured at four buoys in the area for June 2, 2003, the day when the satellite maps were produced. If you compare the wind speed estimates shown in the map derived from satellite measurements with the buoy measurements, you can see some agreement and some disagreement between the two data. The data from buoy 46013, which is the northern-most of the buoys show consistently higher wind measurements than the other buoys. This agrees with the map, which shows higher winds in the north. However, the data from buoy 46013 reports consistently higher wind speeds than the satellite derived map.
Compare the map- and buoy-based wind speed estimates for the additional buoy locations. Are the measurements consistent? If you compare the sea surface temperature estimates shown in the map derived from satellite measurements with the buoy measurements of water temperature, again, you can observe some agreement and some disagreement. For example, the map shows the warmest region is in the south of the region. This is consistent with the buoy observations - buoy 46028, the southern-most buoy, shows the warmest water temperatures. It is important to note that the buoys measure water temperature at a depth of approximately 1 meter below the sea surface, whereas the satellite-based maps estimate the water temperature at the sea surface. Therefore, the satellite-based maps will often show temperatures that fall in between the water temperature measurements obtained by the buoys, and the air temperature measurements obtained by the buoys. Compare the buoy-based water temperature and air temperature measurements with the satellite-derived estimates of sea surface temperature. Which buoy-based measurement (air or water temperature) is closer to the satellite-based sea surface temperature estimates?