Tutorial
How the website works.
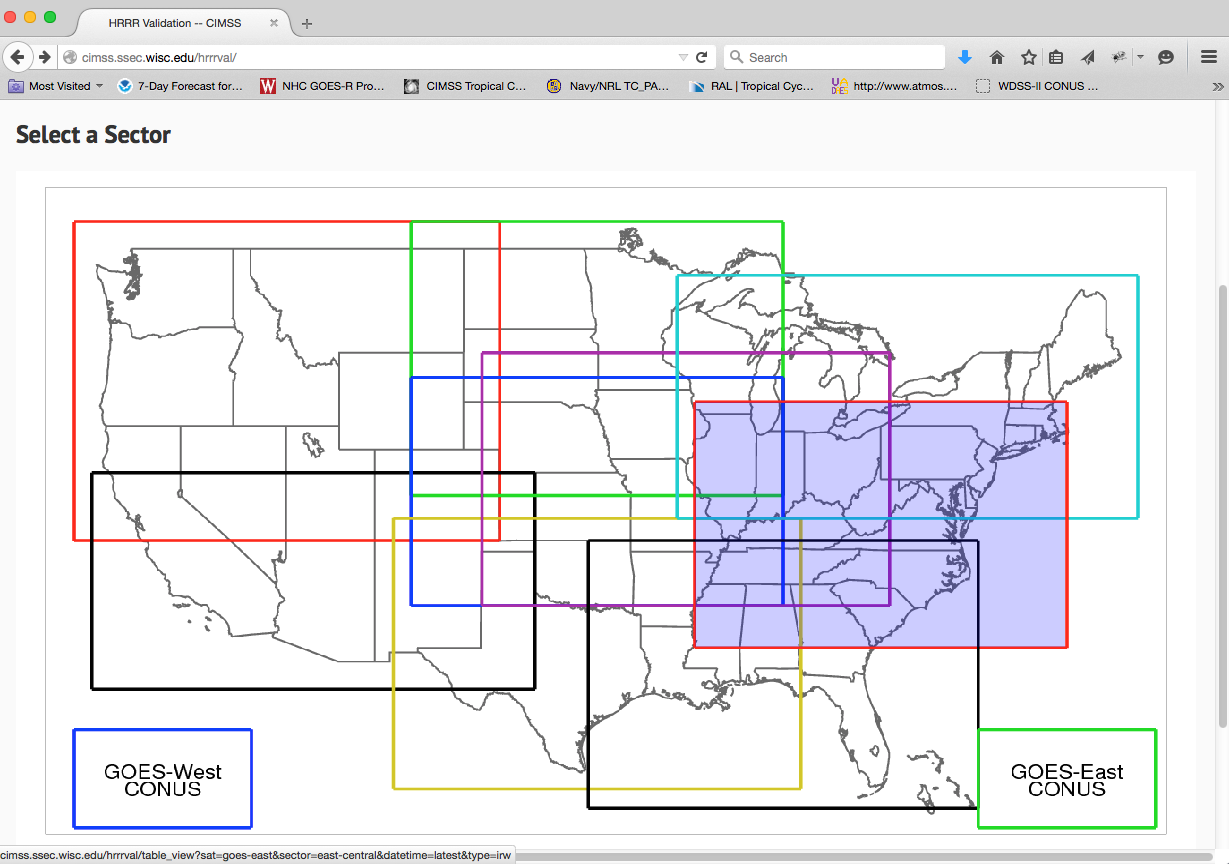
Start by selecting the sector you would like to view by mousing over the map. Click once the sector you are interested in is highlighted.
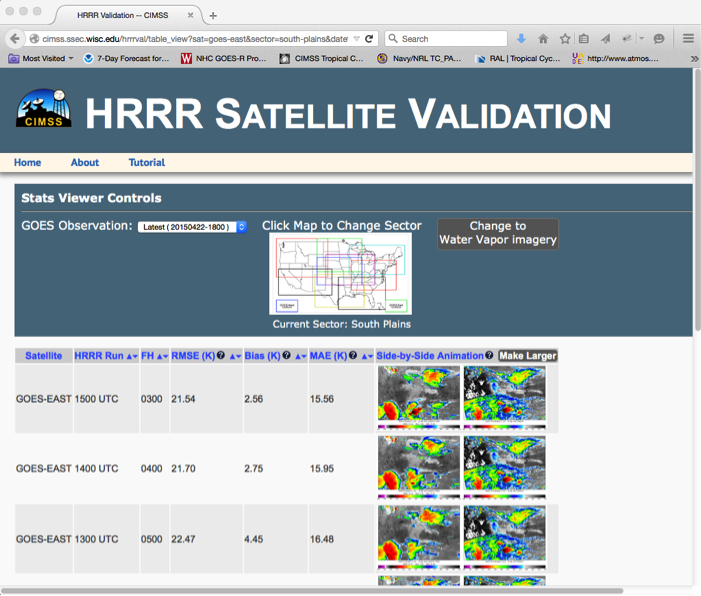
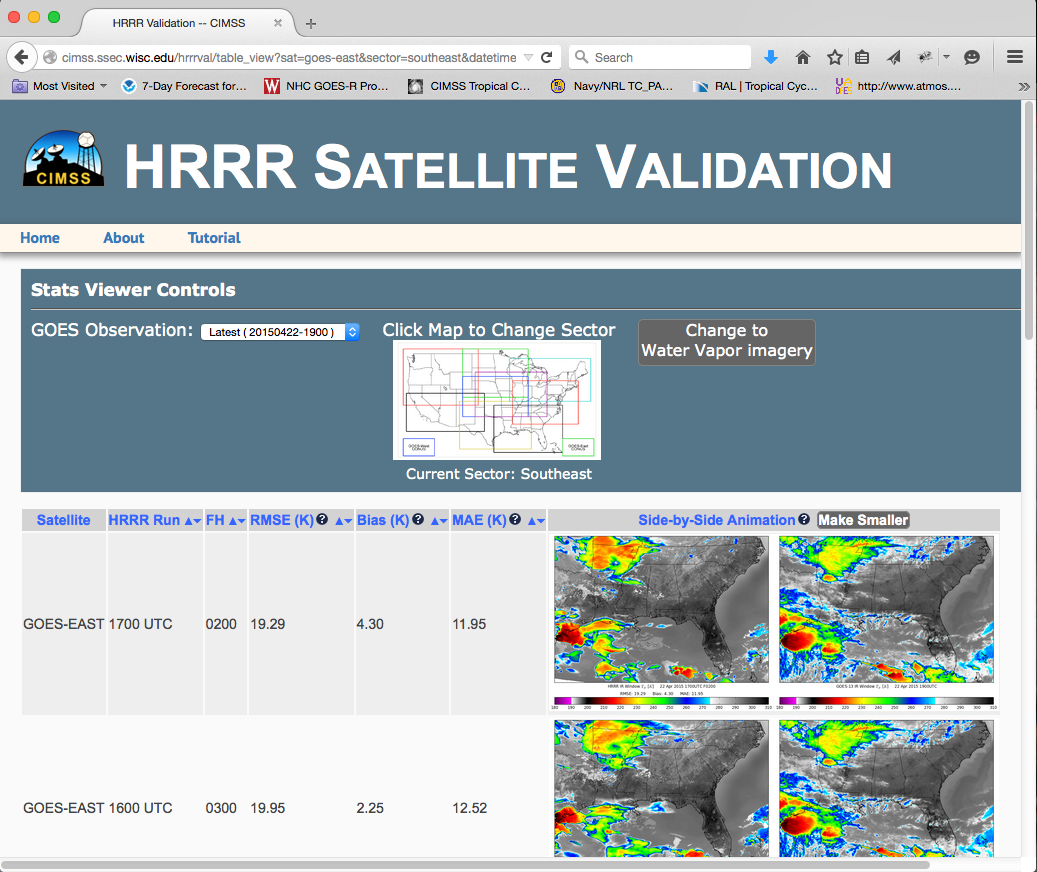
You will then be directed to the regional analysis page that includes statistics and observed and simulated 11µm brightness temperature imagery for the chosen sector and for all of the available HRRR model forecast cycles
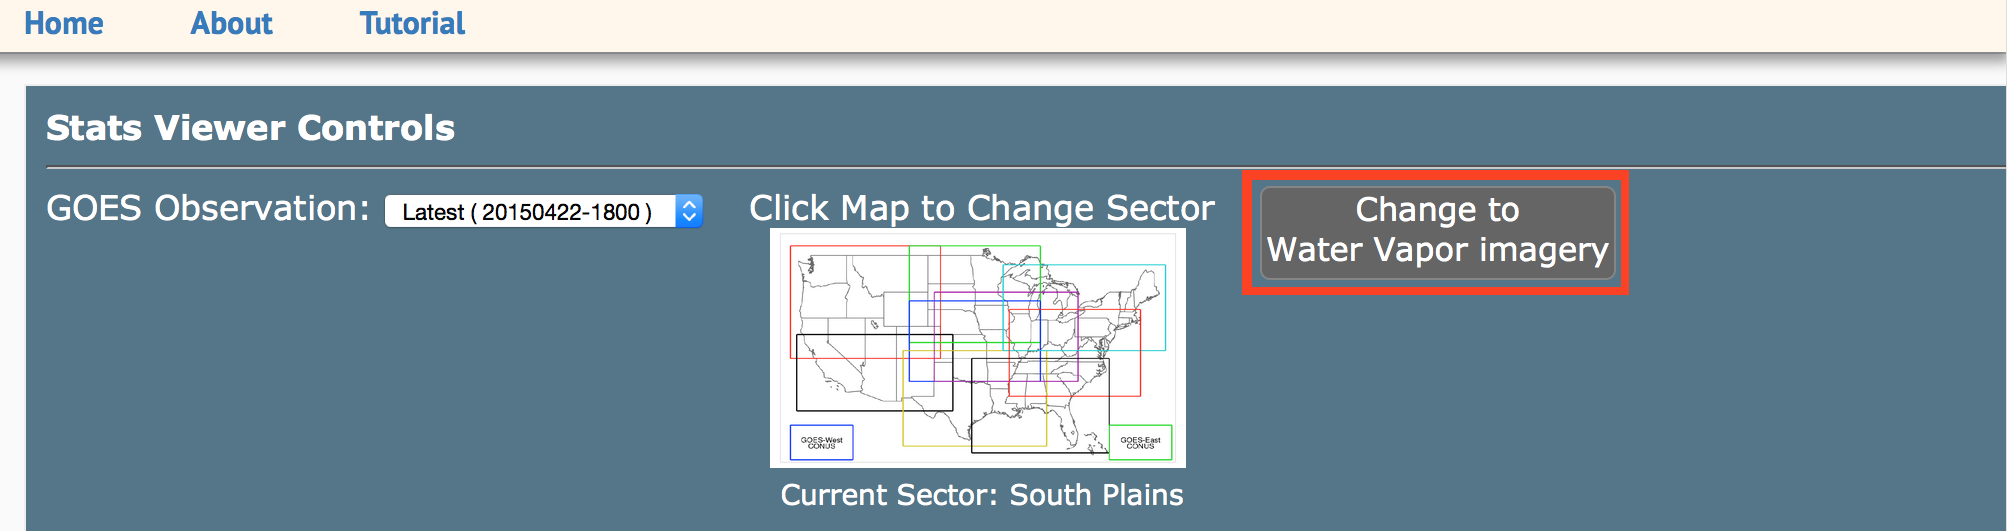
An older GOES observation date/time can be selected from the drop-down menu,
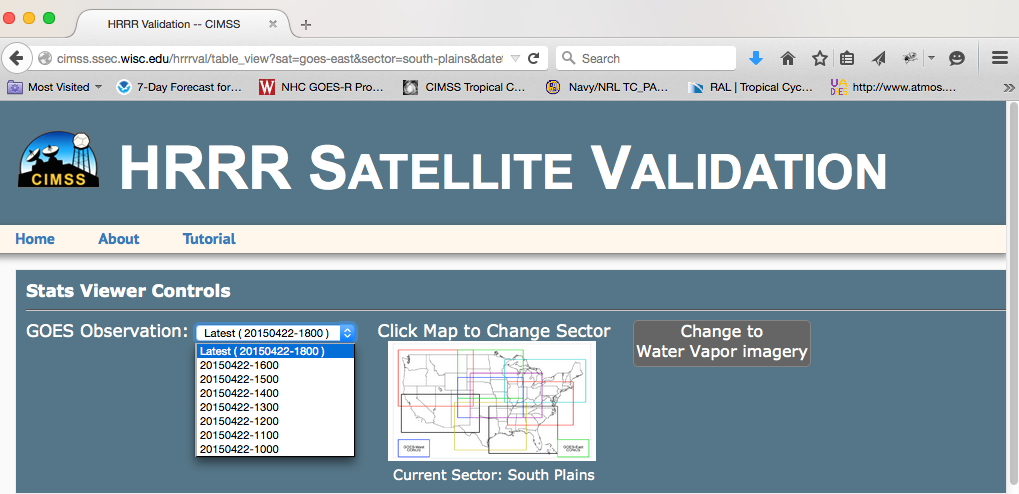
and 6.7 um water vapor imagery can be chosen by clicking "Change to Water Vapor Imagery" icon to the right of the domain map.
The table will include up to the last 10 HRRR model forecast cycles if they are all available, valid at the selected GOES observation time. By default, the forecast cycles are sorted from the most recent to oldest from top to bottom on the page; however, the forecast cycles can also be ranked by each statistical measure (see below).
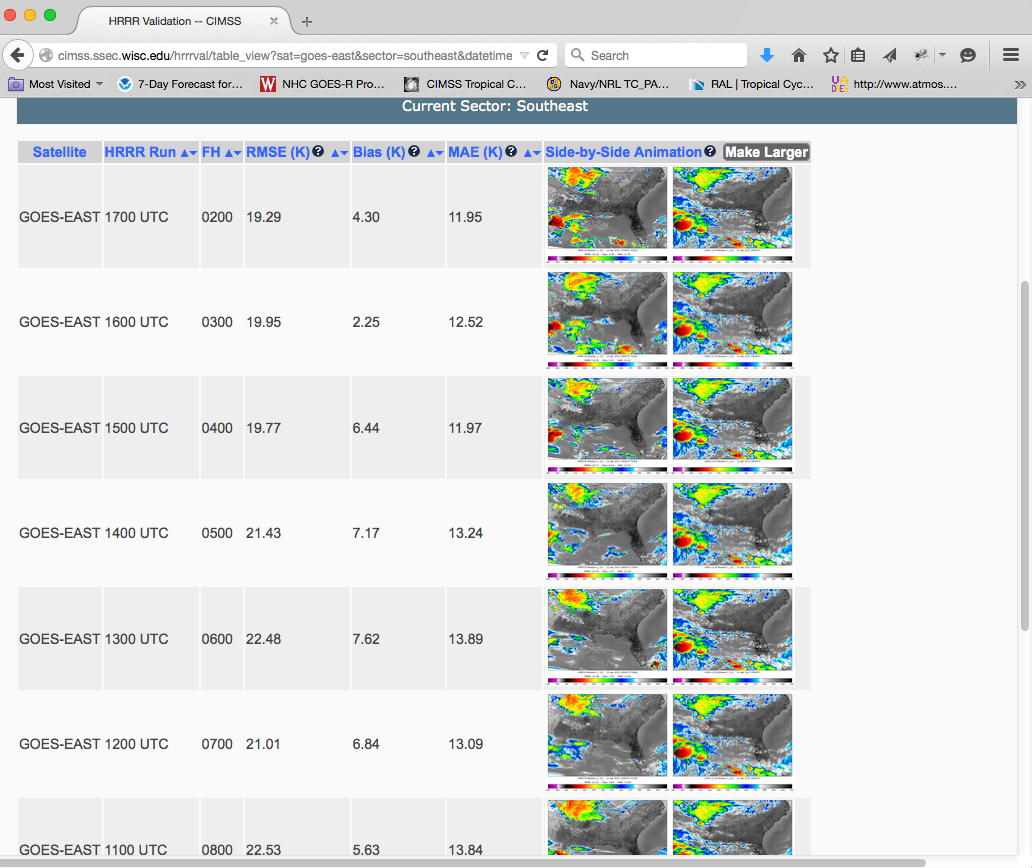
There are seven descriptors in the default table, as indicated by the top row.

Satellite: This indicates which satellite is used for the GOES observations. The two available satellites are GOES-East and GOES-West.
HRRR Run: The start time of each HRRR run. Clicking on the arrows next to "HRRR Run" sorts the HRRR forecasts from the earliest in the day to the latest. This does not account for the date that the forecast was generated, and the 00h HRRR will be sorted first even though the 2100 HRRR is from the previous day.
FH: The forecast hour from each HRRR run that corresponds to the time of the GOES observation. Clicking on the arrows to the right of the "FH"label sorts the HRRR forecasts hours from the most recent forecast to oldest forecast.
RMSE (K): The Root Mean Square Error (RMSE) of each forecast. Clicking on the arrows to the right of the "RMSE" label sorts the HRRR forecasts based on their accuracy as assessed by the RMSE. The RMSE is the square root of the average of the square of all of the errors. By squaring all of the errors, more influence is given to errors with a greater magnitude, so an error of 6 K is more than twice as bad an error of 3 K.
Bias (K): The overall bias of each HRRR forecast. Clicking on the arrows to the right of the "Bias" label sorts the HRRR forecasts based on their accuracy as assessed by the bias. The bias is the HRRR brightness temperature minus the GOES brightness temperature divided by the number of HRRR pixels. A negative bias indicates that the simulated brightness temperatures are colder than average when compared to the observations.
MAE (K): The mean absolute error (MAE) of each HRRR forecast. Clicking on the arrows to the right of the "MAE" label sorts the HRRR forecasts based on their accuracy as assessed by the MAE. The MAE is the average of the absolute value of the HRRR brightness temperature minus the GOES brightness temperature.
Side-by-Side Animations Make Larger: This is a visualization tool. Clicking "Make Larger" will make images appear larger on the screen, however the user will likely need to scroll up and down the page to view all of the model forecast cycles.
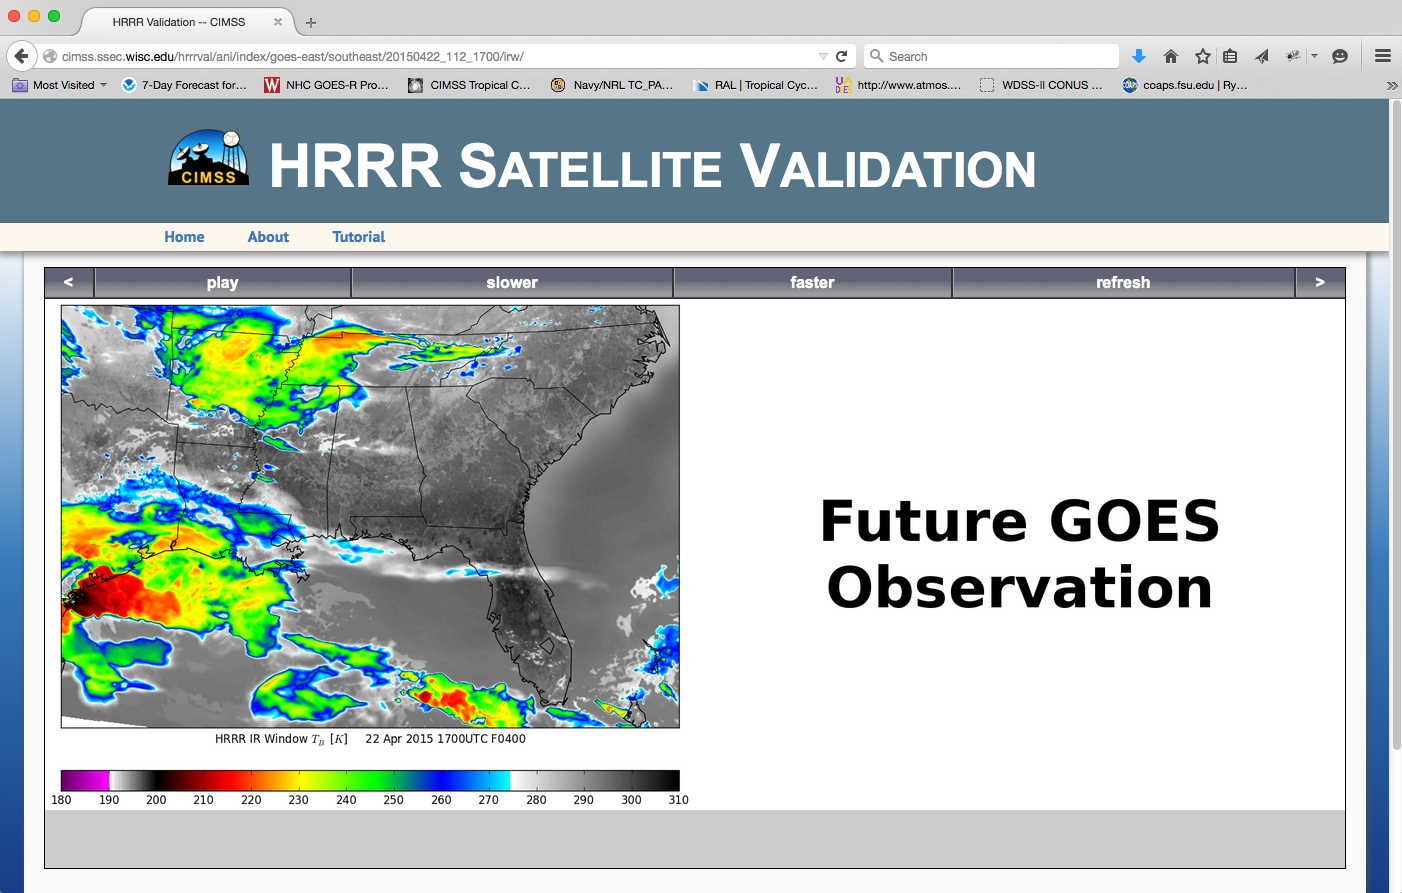
For each HRRR run observed in the table, a side-by-side animation HRRR and GOES is available and can be accessed by clicking on the image in the final column. This will allow users to see how a specific HRRR forecast continues to progress compared to the simulated brightness temperatures. The simulated HRRR brightness temperature forecast is shown on the left panel, and the corresponding GOES observations are shown on the right panel. If GOES observations are available at the HRRR forecast time, the RMSE, Bias, and MAE will also be shown before the HRRR forecast image.
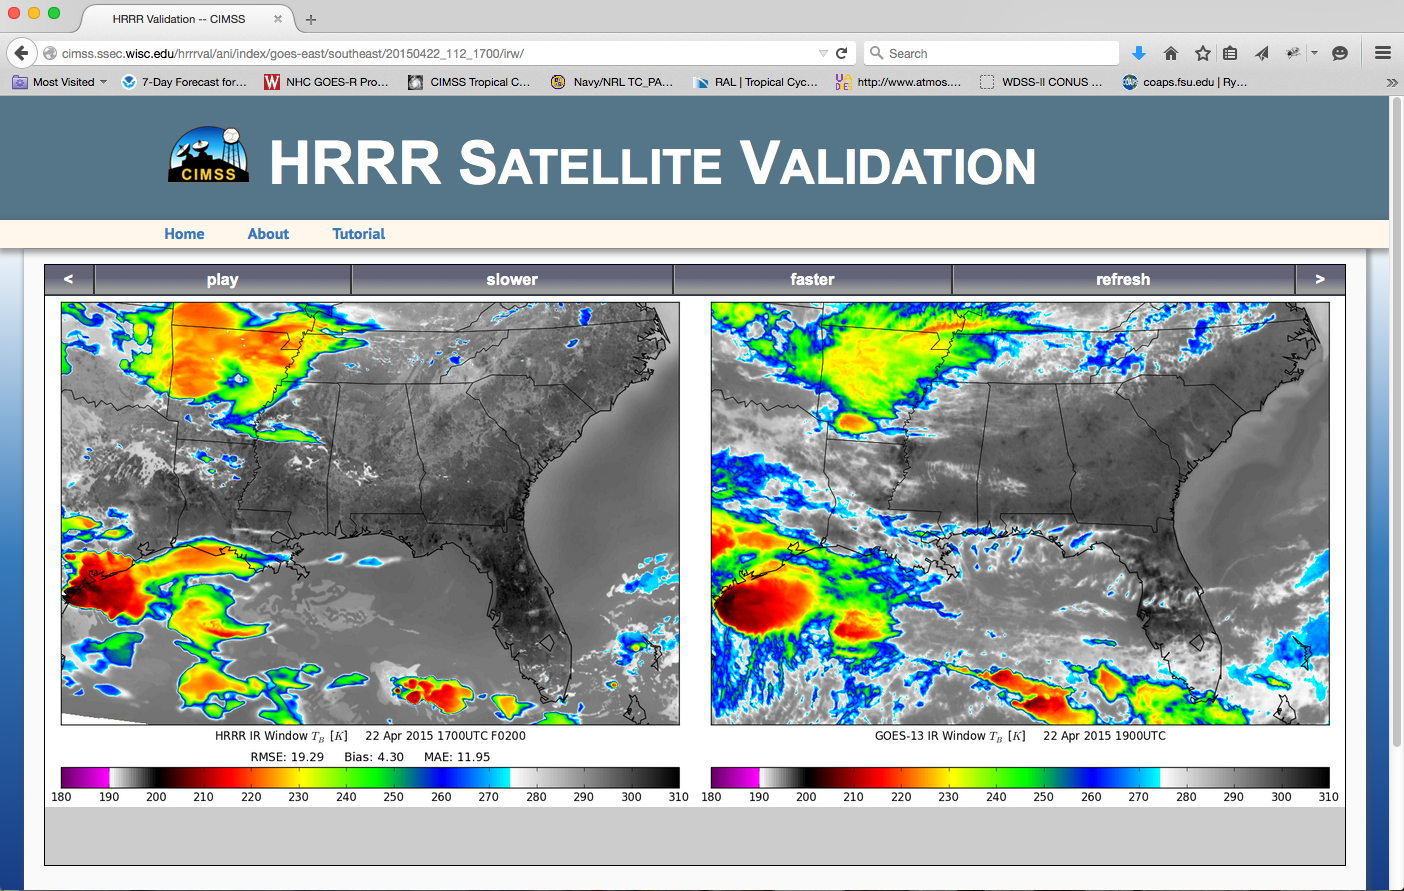
If there are no GOES observations for the forecast time, "Future GOES Observation" will appear in the right panel. For these cases, no RMSE, Bias, and MAE values are available. These times will be filled-in as additional GOES observations become available.