
|

|
|
|
|
A prolonged period of unseasonably warm and dry conditions (record-setting maximum temperatures in the 80's and 90's F) persisted across Alaska and the Canadian Yukon Territory during the latter half of June 2004, creating an environment favorable for numerous large wildfires in that region. As of 02 July, over 1 million acres had burned in the 7 major fire complexes in Alaska. GOES-10 visible channel imagery from 20 June (above, left) shows the areal extent of the thick smoke (with some pyrocumulus clouds evident), while shortwave IR imagery (above, right) reveals several fire "hot spots" (black enhancement). A comparison of GOES-10, GOES-11, and GOES-12 visible and shortwave IR imagery showed some interesting variations that result from the 3 different geostationary satellite viewing angles. Sites such as IDEA and the UMBC Smog Blog began to follow the long range transport of this smoke to monitor the potential threat of this aerosol adversely affecting the air quality farther south over the Lower 48 states.
NOAA HMS fire and smoke product |
|
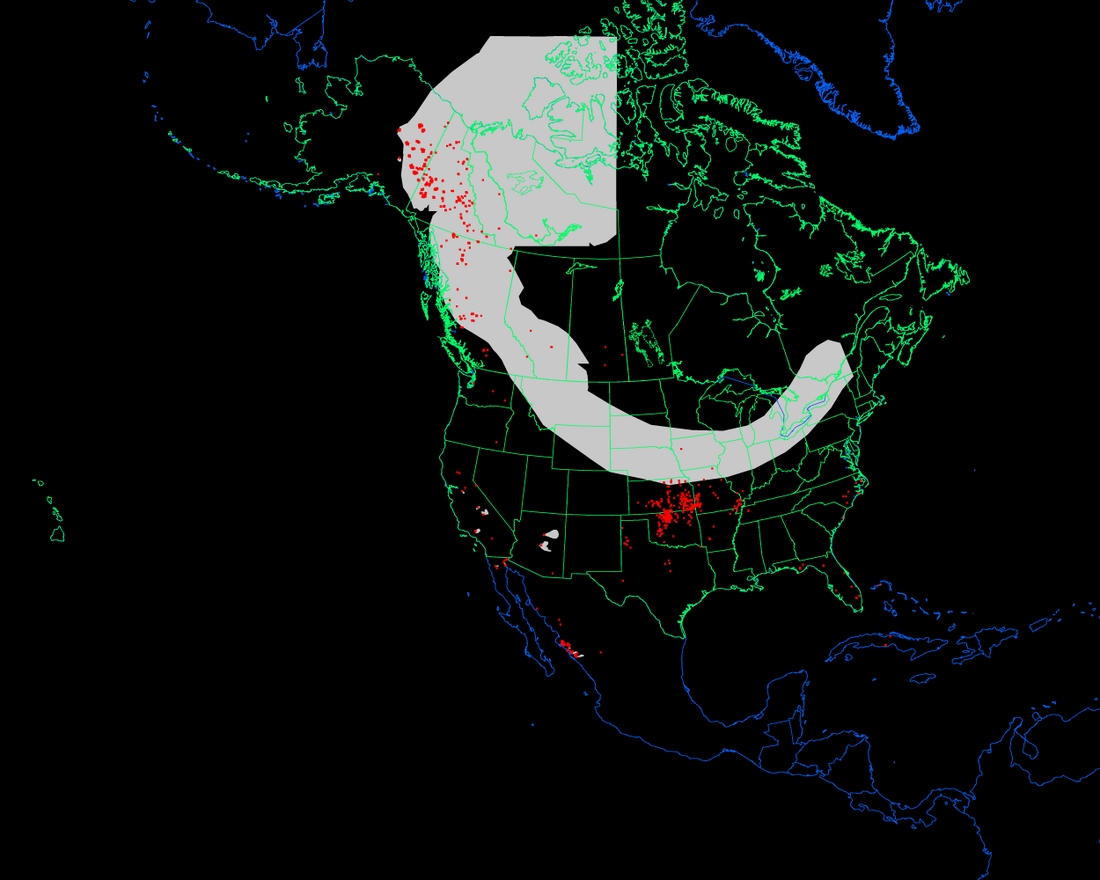
A series of daily NOAA/NESDIS Hazard Mapping System (HMS) Fire and Smoke Products (above, left) shows the increase in areal coverage of fires in Alaska and the Yukon Territory from 13 June to 01 July 2004, along with the subsequent long range transport of much of this smoke southeastward across the Upper Midwest, the Great Lakes, and the Northeast US. The HMS product includes fire count input from the CIMSS WF_ABBA algorithm.
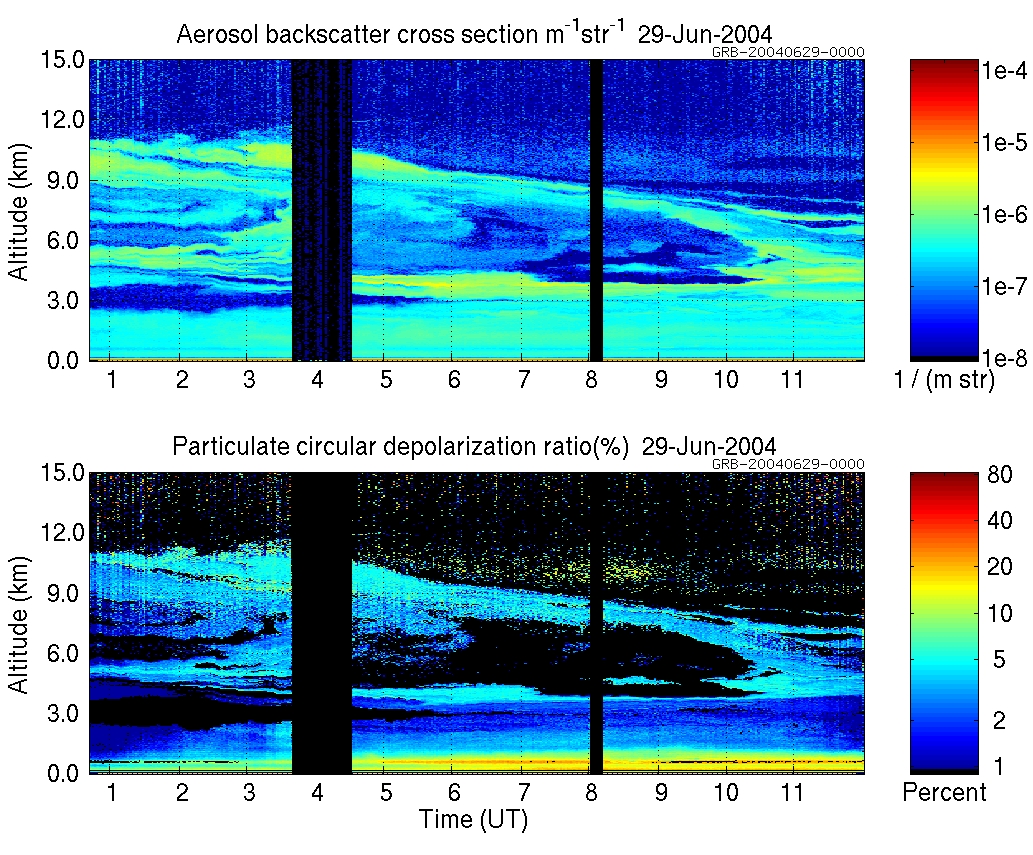
Early in the period, transport was influenced by a large polar vortex circulation over eastern Canada, which brought significant amounts of smoke southward across western Canada and into the northcentral US. As the polar vortex persisted, this smoke was then transported eastward across the Upper Midwest/Great Lakes regions and eventually the Northeast US. This airborne smoke was detected by the University of Wisconsin-Madison Arctic High Spectral Resolution Lidar (above, right), which showed multiple elevated aerosol layers (located 3-12 km above the surface) exhibiting impressive laminar structure on several days in late June.

|
|
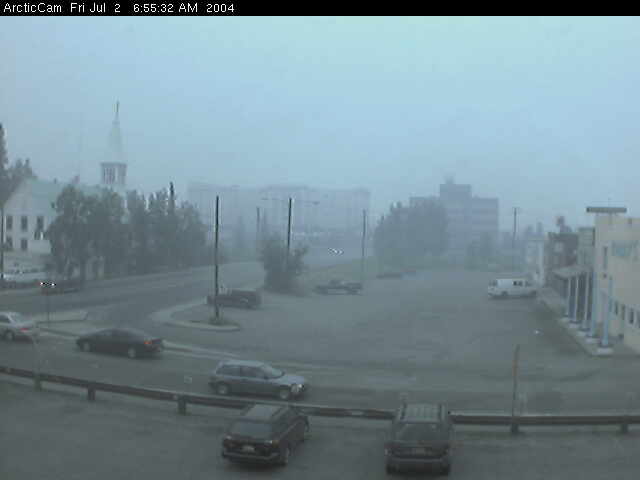
Changing flow patterns toward the end of June terminated the transport of smoke toward the Lower 48 states, and much of the smoke then began to drift westward from the fire source regions, causing air quality problems in much of central interior Alaska during late June and early July. NOAA-15 AVHRR 3-channel composite imagery (above, left) showed the thick smoke along and west of the Alaska/Yukon border on 30 June, while shortwave IR imagery revealed several fire "hot spots" (black to red enhancement) across that region (fade between NOAA-15 composite and shortwave IR images). The MODIS Rapid Response System produced several striking images of the smoke and fire hot spots during this period, such as this one on 29 June 2004. Web camera imagery from Fairbanks AK on 02 July (above, right) showed the effect of the smoke on reducing visibility (surface observations at Fairbanks reported visibilities as low as a quarter of a mile for several days).
The 2004 wildfire season ended up being the worst on record for Alaska in terms of acreage burned (6.6 million acres).
National Fire News | WF_ABBA | NOAA HMS | visible satellite animation | MODIS DB | MODIS Rapid Response

 (-
(- 