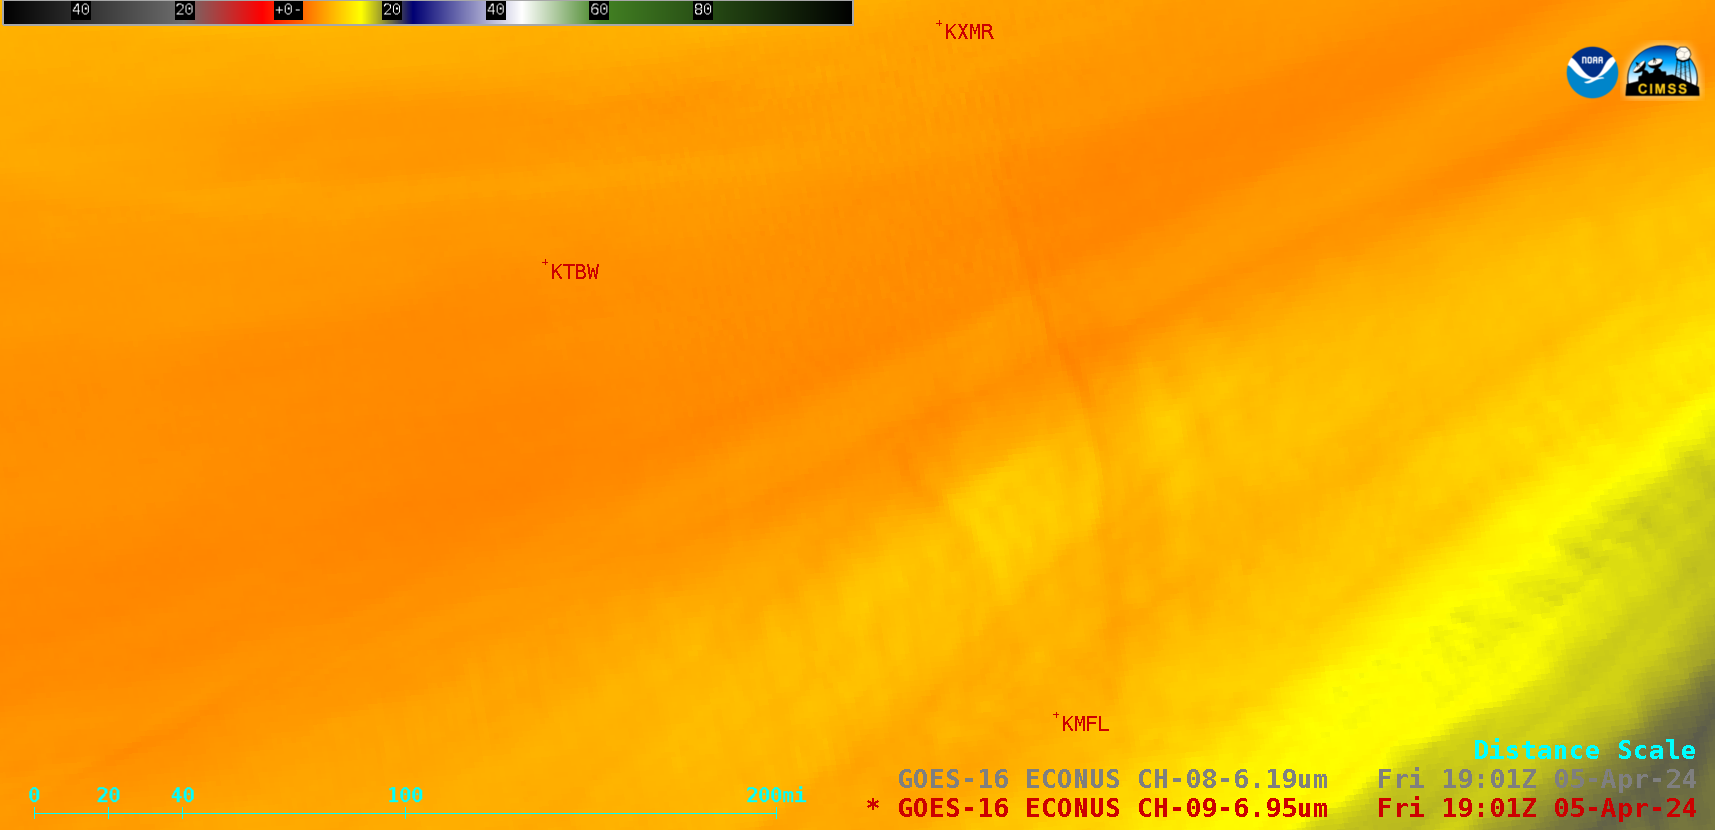
5-minute CONUS Sector GOES-16 (GOES-East) Mid-level Water Vapor (6.9 µm) and Upper-level Water Vapor (6.2 µm) images (above) revealed that the outline of a portion of Florida’s east coast (specifically along the Gold Coast and the Emerald Coast) could briefly be seen during the day on 05 April 2024. 1901 UTC Water Vapor images with/without... Read More

GOES-16 Mid-level (6.9 µm) and Upper-level (6.2 µm) Water Vapor images (with/without a map overlay), from 1201 UTC on 05 April to 0001 UTC on 06 April; rawinsonde sites are plotted in red [click to play animated GIF | MP4]
5-minute CONUS Sector GOES-16
(GOES-East) Mid-level Water Vapor (
6.9 µm) and Upper-level Water Vapor (
6.2 µm) images
(above) revealed that the outline of a portion of Florida’s east coast (specifically along the Gold Coast and the Emerald Coast) could briefly be seen during the day on
05 April 2024. 1901 UTC Water Vapor images with/without a map overlay are shown below. The outline of Florida has been evident in Water Vapor imagery in the past, but usually during the much colder and drier winter months (for example,
February 2019).
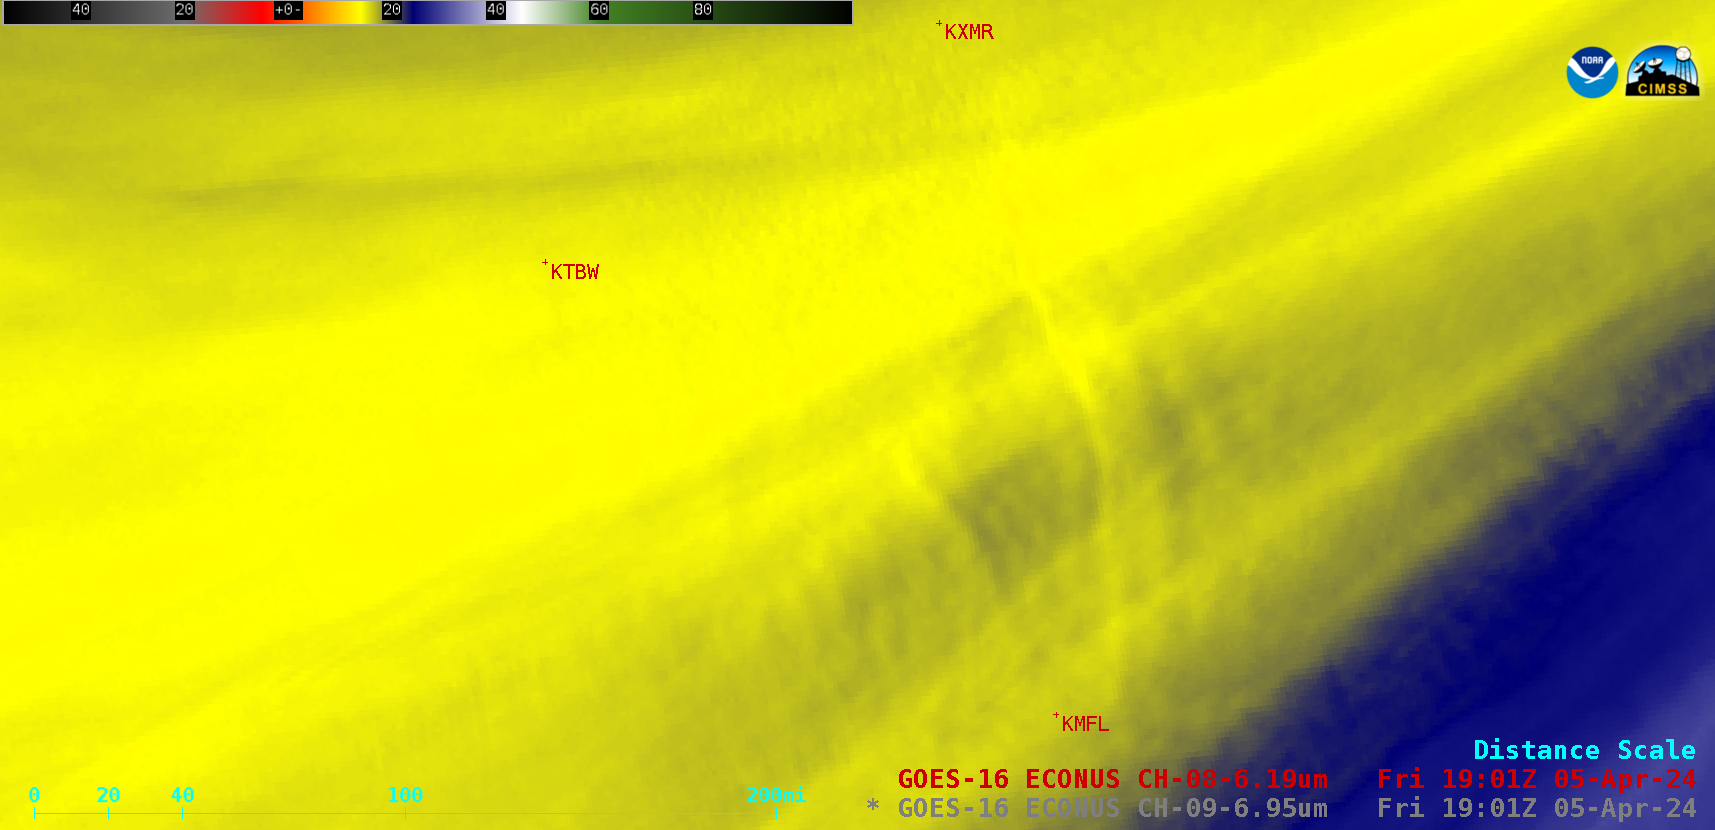
GOES-16 Mid-level (6.9 µm) and Upper-level (6.2 µm) Water Vapor images (with/without a map overlay) at 1901 UTC on 05 April; rawinsonde sites are plotted in red [click to play animated GIF | MP4]
Plot of rawinsonde data from Tampa Bay, Florida at 1200 UTC on 05 April [click to enlarge]
Along the west coast of Florida that morning at Tampa Bay, 1200 UTC rawinsonde data
(above) depicted a Total Precipitable Water value of 0.44 in; while that TPW value was unusually low for Tampa Bay, their sounding climatology
(below) indicated it was greater than the record low 12 UTC / 05 April value of 0.20 in. It is that dry air that then moved eastward across Florida during the day.
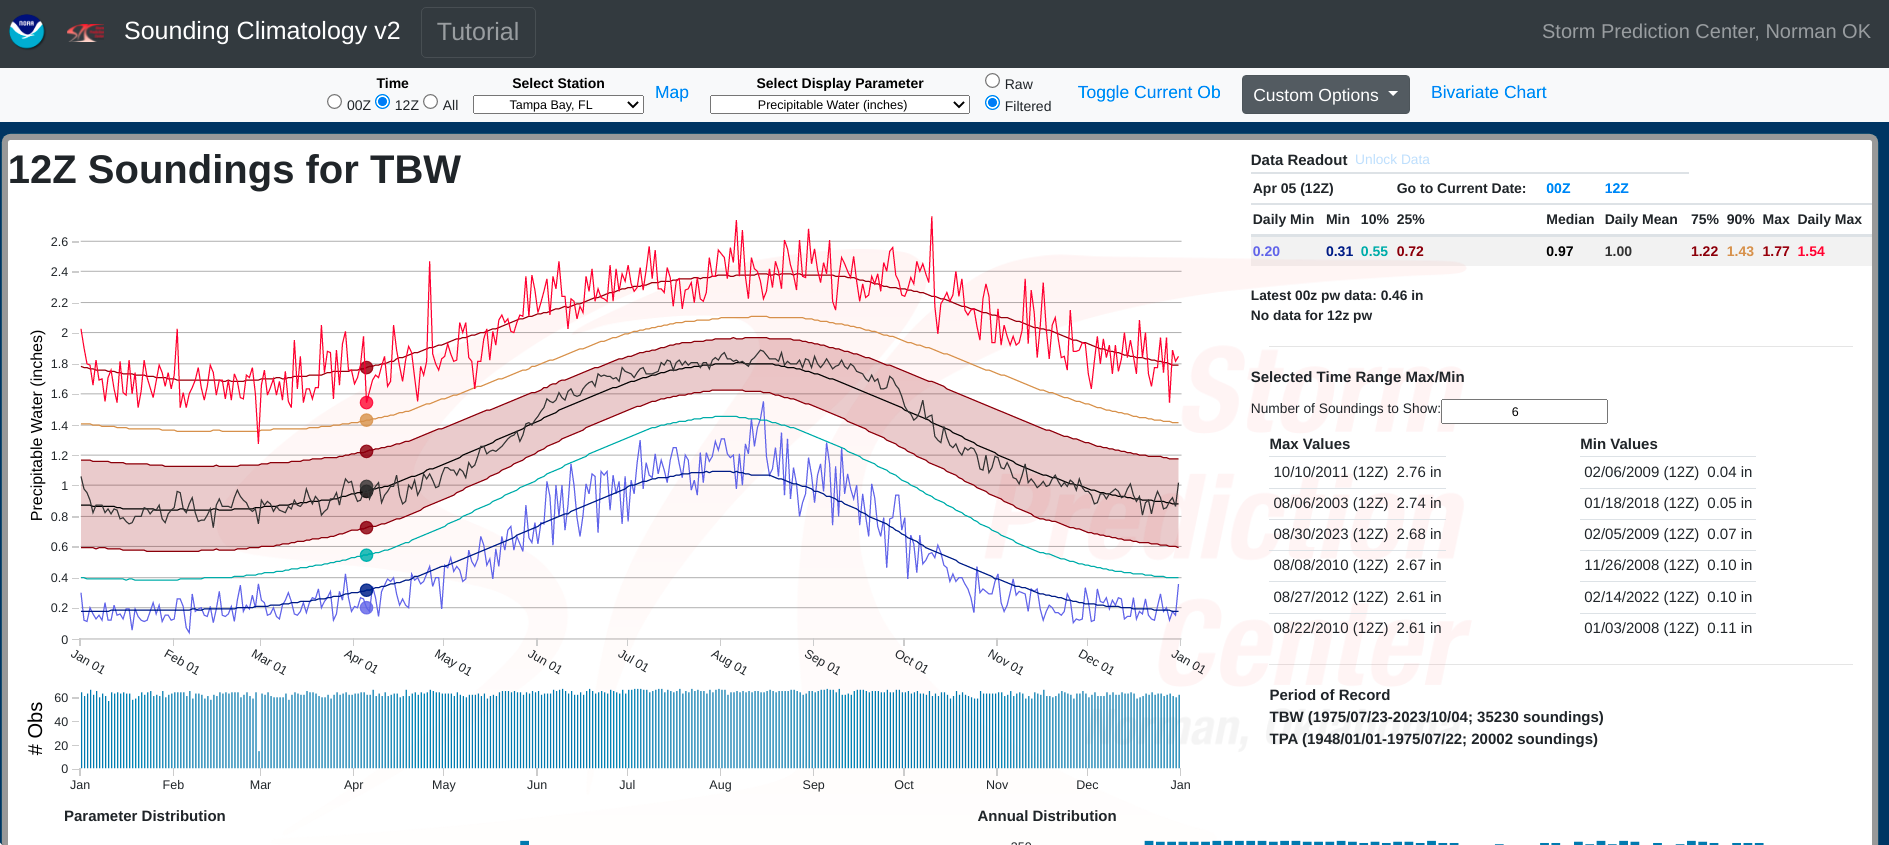
Climatology of Total Precipitable Water for all 1200 UTC soundings on 05 April at Tampa Bay [click to enlarge]
Plots of
Weighting Functions for GOES-16 Mid-level Water Vapor and Upper-level Water Vapor
(below) showed the dry middle/upper-tropospheric air’s effect on the height of the peak contribution for those two spectral bands that morning at Tempa Bay — lowering their peaks to 661 hPa and 535 hPa, respectively — with some radiation being sensed from as low as the 750-850 hPa layer (low enough to detect some of the upwelling radiation emitted by the land/water thermal gradient along Florida’s east coast).
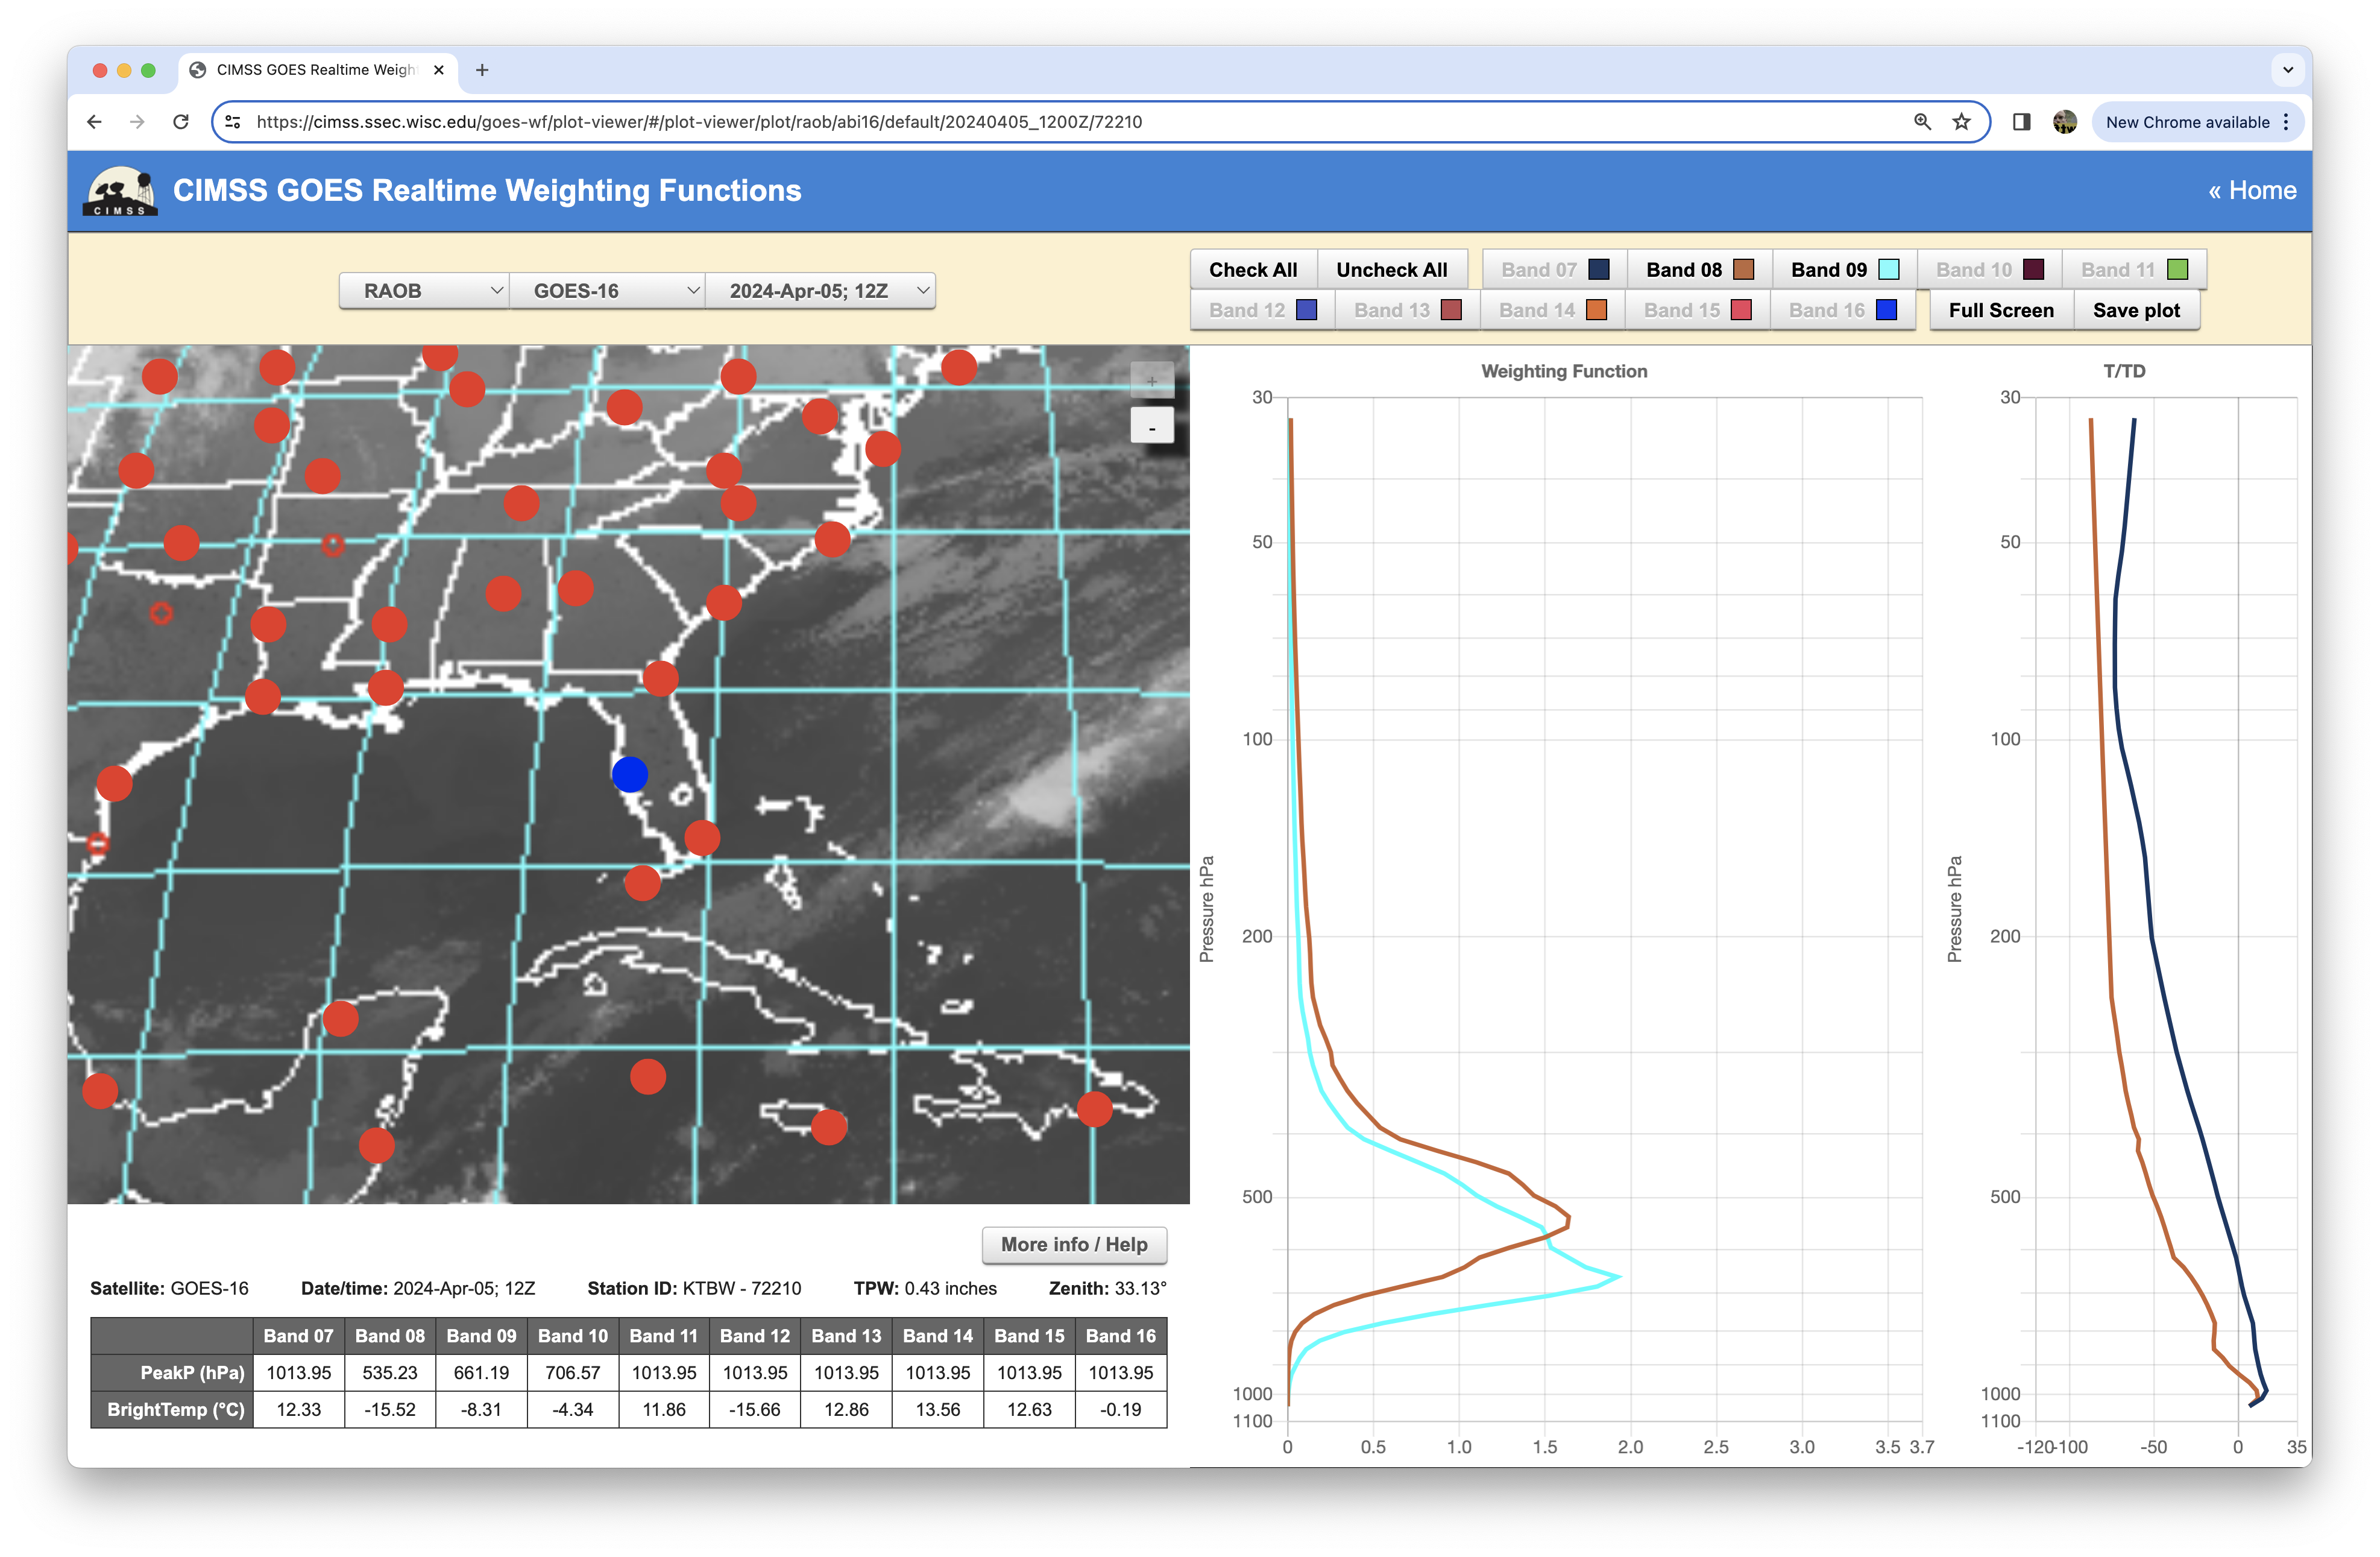
Plot of Weighting Functions for GOES-16 Mid-level Water Vapor (Band 09, cyan) and Upper-level Water Vapor (Band 08, brown), calculated using data from 1200 UTC rawinsonde data from Tampa Bay [click to enlarge]
For reference, the GOES-16 Upper-level Water Vapor (Band 08) and Mid-Level Water Vapor (Band 09) Weighting Functions (calculated using a US Standard Atmosphere temperature/moisture profile, at a satellite Zenith Angle of 35º) typically peak at 344 hPa and 442 hPa, respectively
(below).
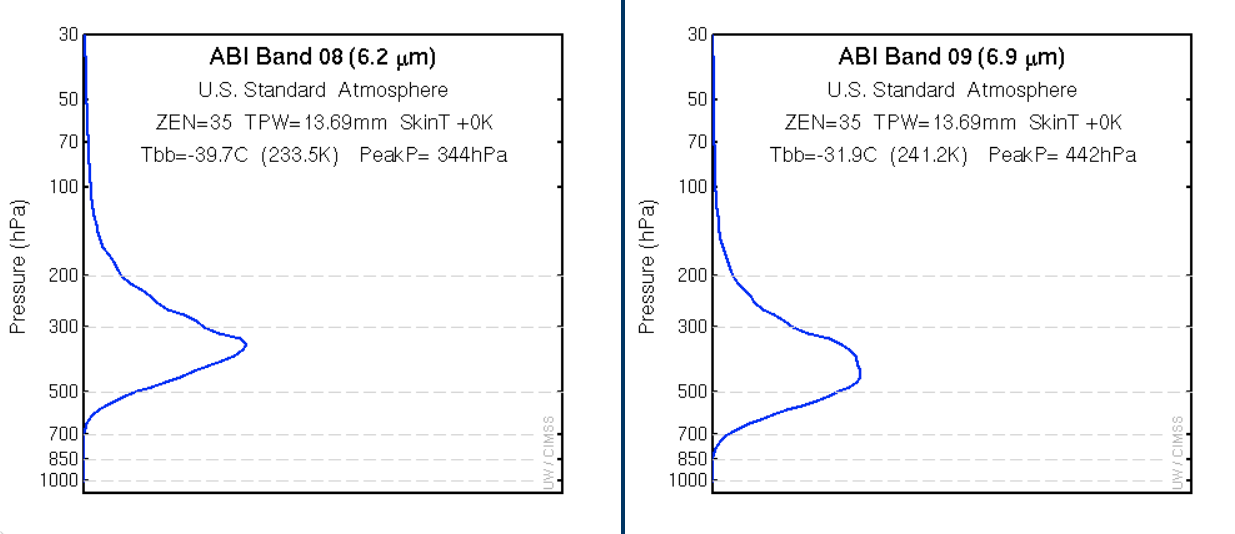
Plots of GOES-16 Upper-level Water Vapor (Band 08, left) and Mid-Level Water Vapor (Band 09, right) Weighting Functions, calculated using a US Standard Atmosphere temperature/moisture profile [click to enlarge]
View only this post
Read Less


