1.38um ABI Band Page
The proposed 1.38um ABI Band has been designed to detect high cirrus
clouds. The current proposal is for the 1.38um band to range from
1.365um to 1.395um. The purpose of this page is to show how the spectral
width of the band will affect cirrus cloud detection. By using
AVIRIS data it was possible to determine a bandwidth which can be considered
a maximum allowed width and consequently a bandwidth that is too large.
Near 1.38um the atmosphere strongly absorbs scattered
solar radiation from the surface and lower troposphere, this is due to
the water vapor in the atmosphere. Since most of the water vapor
in the atmosphere is contained in the lower troposphere, radition scattered
at the surface and in the lower troposphere will most likely be absorbed
by the atmosphere before it can reach a satellite sensor. As the bandwidth of the channel increases, the channel
begins to exit the atmospheric water vapor absorption feature. As the bandwidth increases even more, the spectral window is now more transparent to scattered
radiation from the surface and lower troposphere. Surface features and water clouds will
now be detected by the satellite and hence the images will be polluted with low cloud and surface features. A java script loop of
the proposed ABI Band, maximum allowable width, and unacceptable width has been made
available. This loop allows an easy look at how spectral width affects cirrus/surface
detection. Click here for the loop.

Above is a difference image of the proposed 1.38um ABI Band (1.365-1.395um) v. 1.38um band with
a bandwidth of 1.339-1.424um. ((1.339-1.424um image) - Proposed 1.38um ABI band.).
Note the radiance differences are multiplied by 1000. Below are difference image
histograms of different 1.38um bandwidths compared to the proposed 1.38um ABI Band.

Difference image histogram
(1.355-1.407um) - Proposed 1.38um ABI band.

Difference image histogram (1.348-1.415um)
- Proposed 1.38um ABI band.

Difference image histogram (1.339-1.424um)
- Proposed 1.38um ABI band.
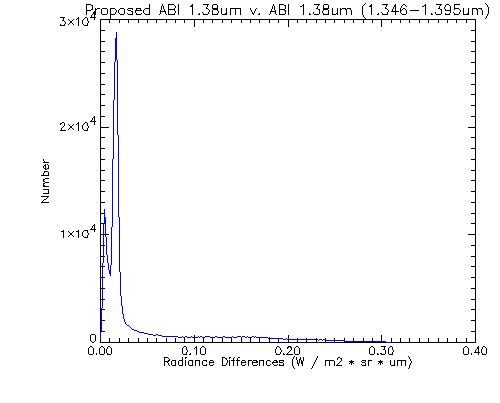
Difference image histogram (1.346 - 1.395um) - Proposed 1.38um ABI band.
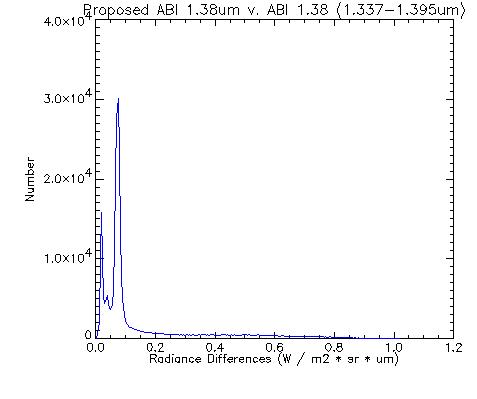
Difference images histogram (1.337 - 1.395um) - Proposed 1.38um ABI band.
Bandwidth Image: Proposed 1.38um ABI Band (red) is centered about the
atmospheric water vapor absorption feature. Radiation detected within
this bandwidth will primarily occur from the mid troposphere and above.
Note the term "Maximum Allowable" refers to the bandwidth 1.348-1.415um and the
term "Unacceptable Width" refers to the bandwidth 1.339-1.424um as seen in the histograms above. The maximum allowable width (yellow) has an expanded bandwidth for increased
signal strength, but begins to encompass areas outside of the atmospheric water vapor absorption
feature. This expanded bandwidth causes slight detection of scattered radiation from
points below the middle troposphere. Any bandwidth that is beyond the maximum allowable
width are deemed unacceptable (green). A bandwidth as wide or wider
than the unacceptable band will receive too much scattered radiation from
the surface and lower troposphere. Images would include low clouds
and surface features which is not the goal of the 1.38um ABI band.
Note: On the above image the light blue band is the MODIS 1.38um spectrum.
Return to top.
Currently proposed 1.38um (1.365um - 1.395um).
Click on image to enlarge. Notice limited radiation detected from
water cloud due to channel being located within atmospheric water vapor
absorption feature. To view images similar to the above image select the following
links. Again, note the term "Maximum Allowable" refers to the bandwidth 1.348-1.415um and the
term "Unacceptable Width" refers to the bandwidth 1.339-1.424um as seen in the histograms above.
Maximum Acceptable
Unacceptable Width
MODIS 1.38um
Back
