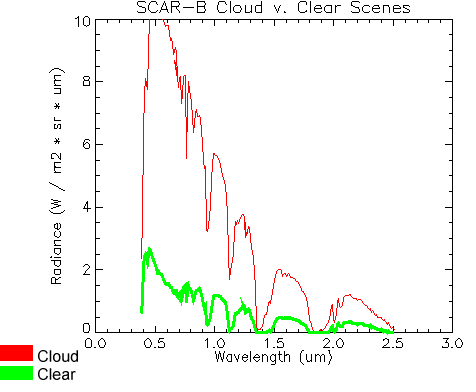
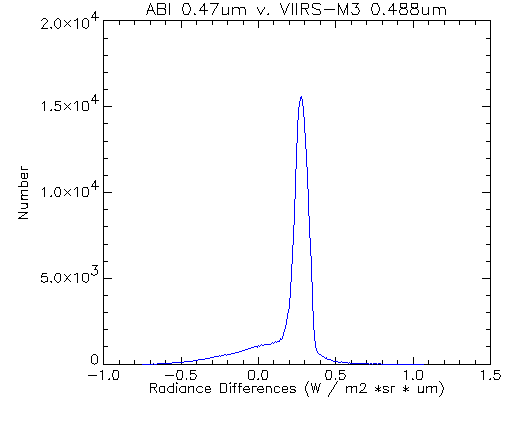
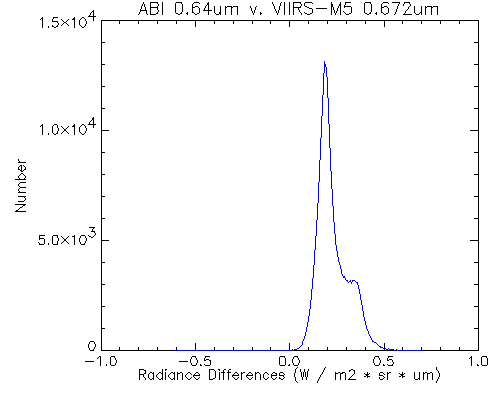
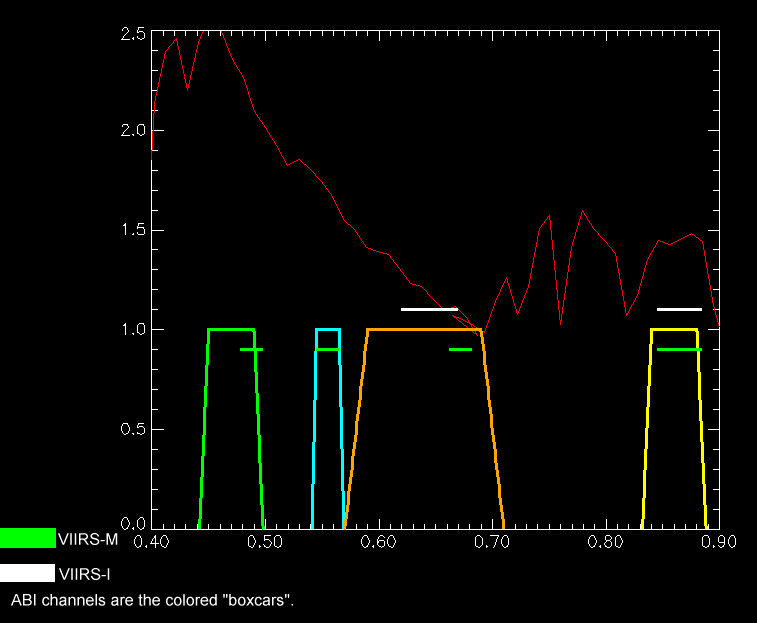
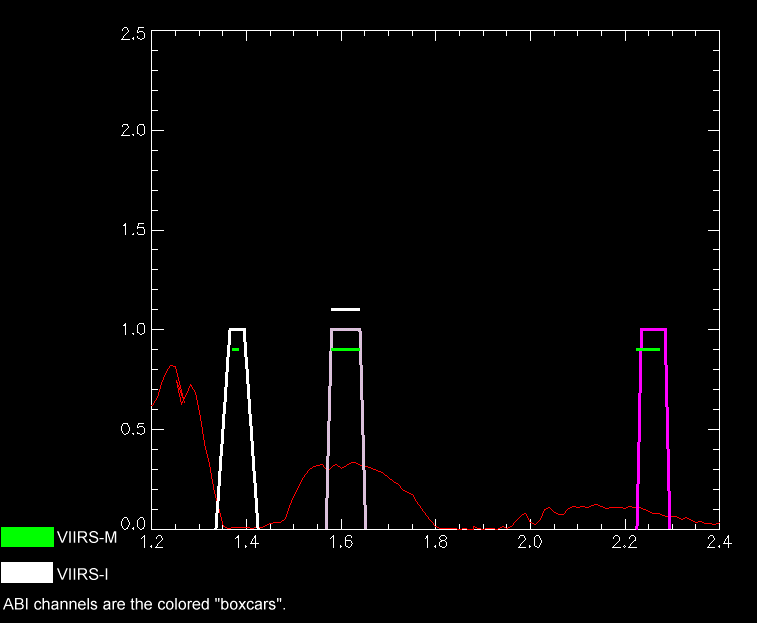
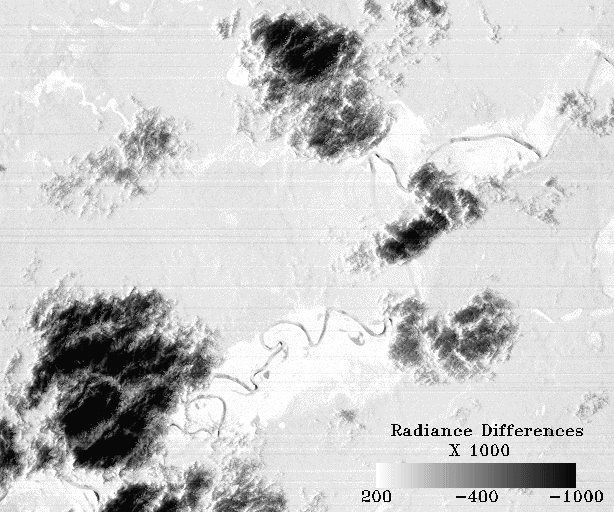
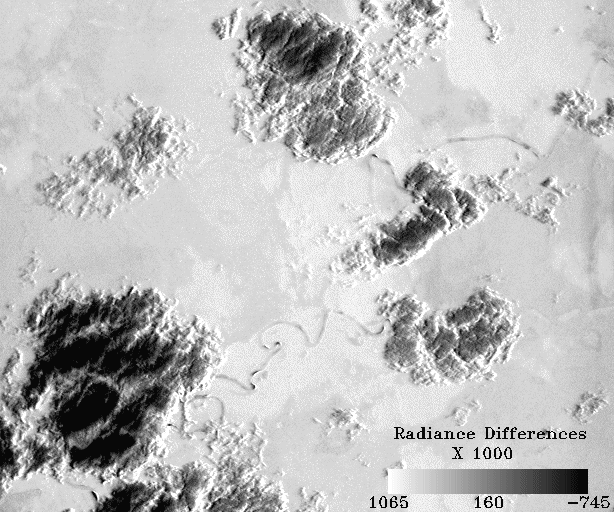
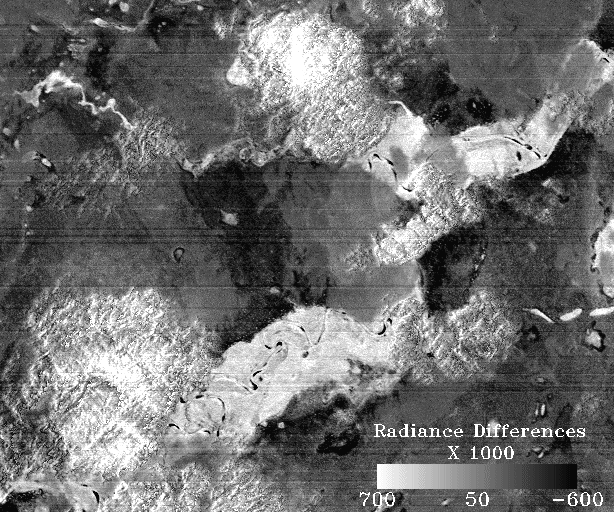
This page serves as a comparison for the proposed ABI channels and the VIIRS channels. Not all channels of the ABI have been compared. Below are links to plots of the ABI and VIIRS bandwidths, the channels with a similar purpose but noticeably different bandwidths have been chosen for comparison. Throughout the following subpages there is often a reference to difference images of two bands. For these differences to have meaning there must be a reference point for comparison. Below is a spectral plot of a clear and cloudy scene over the SCAR-B scene. Notice radiance values going between a clear sky and a cloudy sky can differ as much as eight watts. Refer to this image when attempting to deduce the signficance of the following difference images.