Radiation objective: Contemplate some of the uses of measurements of the solar flux at the surface.
MATLAB objective: Using a tool to perform sensitivity studies. (no need
for any new commands - I don't think)
Solartrans.m computes the transmittance and direct beam solar spectral flux at the surface. It does not include Rayliegh extinction. You need to add this to the file. That's part I of the homework, calculate and plot the solar beam spectral flux at the surface for solar zenith angles of 30 and 60 degrees, for an ozone amount of 0.4 cm and water vapor amounts of 3 cm. Assume a surface pressure of 1013 mb.
Ans.
You needed to use the appropriate equation for
the Rayliegh extinction coefficient given in the notes. You should
have learned that as the solar zenith angle increases, the amount of direct
beam radiation at the surface decreases since the path length increases.
The decrease in flux is enhanced when normalized to a horizontal surface.
For Part II, you can use this program or, if you deem it appropriate, write another more efficient script. Here's the problem. You want to estimate the total amount of water vapor (in cm) in the atmosphere by measuring the direct solar beam flux at the surface. Your mission is to select a wavelength at which to make these measurements. You must support your selection (there are a number of correct answers) using calculations and any other material you feel is relevant to the problem. (Hint: what you know - the top of atmosphere spectral flux and once the instrument is built, you will also have the measured surface spectral flux at the surface. What you need is a good relationship between these two known parameters and U, the parameter you want.)
Ans.
First think to do is find some wavelengths for which transmittance is sensitive to changes in water vapor amount. So I wrote a script to plot the following (note in the script I could select any 4 wavelengths). The stronger absorption lines are not very sensitive to change in large water paths, though they may be useful in polar regions where the water concentrations is small. The spectral regions near 0.95 and 1.15 microns have good sensitivity for a broad amount of atmospheric water vapor.
![]()
Of course, there is more gases in the atmosphere than water vapor. So at some wavelengths, absorption by other gases could result in errors. To investigate this I plotted the error in a retrieved water vapor amount as a function of wavelength. The matlab file to calculate this error is attached at the end. Notice, the retrieved amount is determined by allowing absorption by all gases as well as Rayliegh scattering. This was computed using two water vapor amounts, 4.0 cm (blue line) and 0.4 cm (red line). The results are depicted in the following figure.
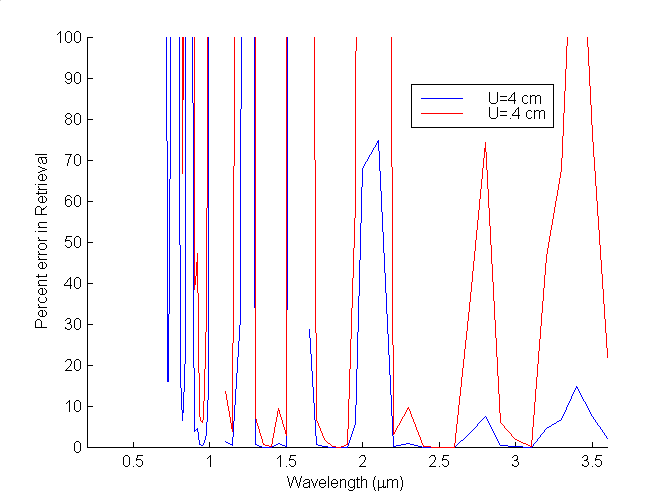
So, based on analysis of these to figures I would
pick a wavelength of about 0.95 microns. This wavelength is sensitive
to the amount of water vapor in the atmosphere, and the retrieval error
is small (due primarily to the effects of Rayliegh scattering).
%
% This routine computes
and plots spectral transmittance as a function of water vapor amount
% It is not normalized to
a horizontal surface and includes on h2o vapor.
% It uses the parameterizations
listed in the class notes.
%
%
% Written by S. Ackerman
April 1, 1998
%
load sunspec.out % load data
wavelength=sunspec(:,1); % wavelength in microns
solar_toa=sunspec(:,2); % top-of-atmosphere solar spectral flux
o3coef=sunspec(:,3); % ozone absorption coefficient
mixcoef=sunspec(:,4); % CO2, O2 absorption coefficient
h2ocoef=sunspec(:,5); % water vapor coefficient
o3amount=0.3; % set ozone amount (cm)
h2oamount=.2:.1:6.0; % set water vapor amount (cm)
solar_zenith=30.; % set solar zenith angel in degrees
pressure=1013.; % set pressure at surface
rad_per_degree=pi/180.; % radians per degree
cossolar=cos(solar_zenith*rad_per_degree);
mr=(cossolar+0.15*(93.885-solar_zenith)^-1.253)^-1;
ma=mr*pressure/1013.;
hold;
for j=1:152;
for i=1:59
h2otrans(j,i)=exp(-(0.2385*h2ocoef(j).*h2oamount(i).*mr./(1+20.07*h2ocoef(j)*mr).^0.45));
end
end
for i=1:59
% .95 micron
h2owave1(i)=h2otrans(105,i);
% 1.15 micron
h2owave2(i)=h2otrans(115,i);
%1.4 micron
h2owave3(i)=h2otrans(120,i);
% 2.5 micron
h2owave4(i)=h2otrans(137,i);
end
plot(h2oamount,h2owave1,h2oamount,h2owave2,h2oamount,h2owave3,h2oamount,h2owave4);
xlabel('Water Vapor Amount
(cm)');
ylabel('Spectral Transmittance');
legend ('0.95 \mum','1.15
\mum','1.4 \mum','2.5 \mum');
load sunspec.out % load data
wavelength=sunspec(:,1); % wavelength in microns
solar_toa=sunspec(:,2); % top-of-atmosphere solar spectral flux
o3coef=sunspec(:,3); % ozone absorption coefficient
mixcoef=sunspec(:,4); % CO2, O2 absorption coefficient
h2ocoef=sunspec(:,5); % water vapor coefficient
o3amount=0.3; % set ozone amount (cm)
h2oamount=4.0;
% set water vapor amount (cm)
h2oamount2=0.4;
solar_zenith=30.;
% set solar zenith angel in degrees
pressure=1013.; % set pressure at surface
rad_per_degree=pi/180.; % radians per degree
cossolar=cos(solar_zenith*rad_per_degree);
mr=(cossolar+0.15*(93.885-solar_zenith)^-1.253)^-1;
ma=mr*pressure/1013.;
Raycoef=0.008735.*(wavelength.^-4);
% Rayleigh coefficient
hold;
Raytrans=exp(-Raycoef.*ma);
o3trans=exp(-o3amount*o3coef/cossolar);
uniformtrans=exp(-1.41*mixcoef*ma./(1+118.93*mixcoef*ma).^0.45);
h2otrans=exp(-(0.2385*h2oamount*h2ocoef*mr./(1+20.07*h2ocoef*mr).^0.45));
h2otrans2=exp(-(0.2385*h2oamount2*h2ocoef*mr./(1+20.07*h2ocoef*mr).^0.45));
total_transmittance = uniformtrans.*o3trans.*h2otrans.*Raytrans
total_transmittance2 = uniformtrans.*o3trans.*h2otrans2.*Raytrans
if total_transmittance <=
0.00001
Uassumed=0
else
Uassumed=(-(1+20.07*h2ocoef*mr).^0.45)./(.2385*h2ocoef*mr).*log(total_transmittance);
end
error=100.*(Uassumed-h2oamount)/h2oamount
if total_transmittance2
<= 0.00001
Uassumed2=0
else
Uassumed2=(-(1+20.07*h2ocoef*mr).^0.45)./(.2385*h2ocoef*mr).*log(total_transmittance2);
end
error=100.*(Uassumed-h2oamount)/h2oamount
error2=100.*(Uassumed2-h2oamount2)/h2oamount2
plot(wavelength,error,wavelength,error2,'red');
axis([0.2 3.6 0 100]);
xlabel('Wavelength (\mum)');
ylabel('Percent error in
Retrieval' );
legend ('U=4 cm','U=.4 cm');
% print to clipboard via
-> print -dbitmap -f1 (then get from clip board)