The NOAA/CIMSS ProbSevere model has been manually evaluted for two days during the 2013 convective season. This evaluation encompasses over 800 storms in geographically diverse locales. This evaluation is preliminary and serves as a general assessment of overall model skill.
The model was scored against two different truth metrics: 1) initial NWS severe thunderstorm and tornado warnings (SVR/TOR) and 2) initial local storm reports (LSRs), including wind damage, hail diameter >= 1", or a tornado. The model, by design, is meant to give the probability that a storm will first produce severe weather, thus, the initial LSRs are used. One other goal of this model is to increase lead time to initial NWS warnings, thus, model skill is also measured to the first NWS warning on storms.
|
|
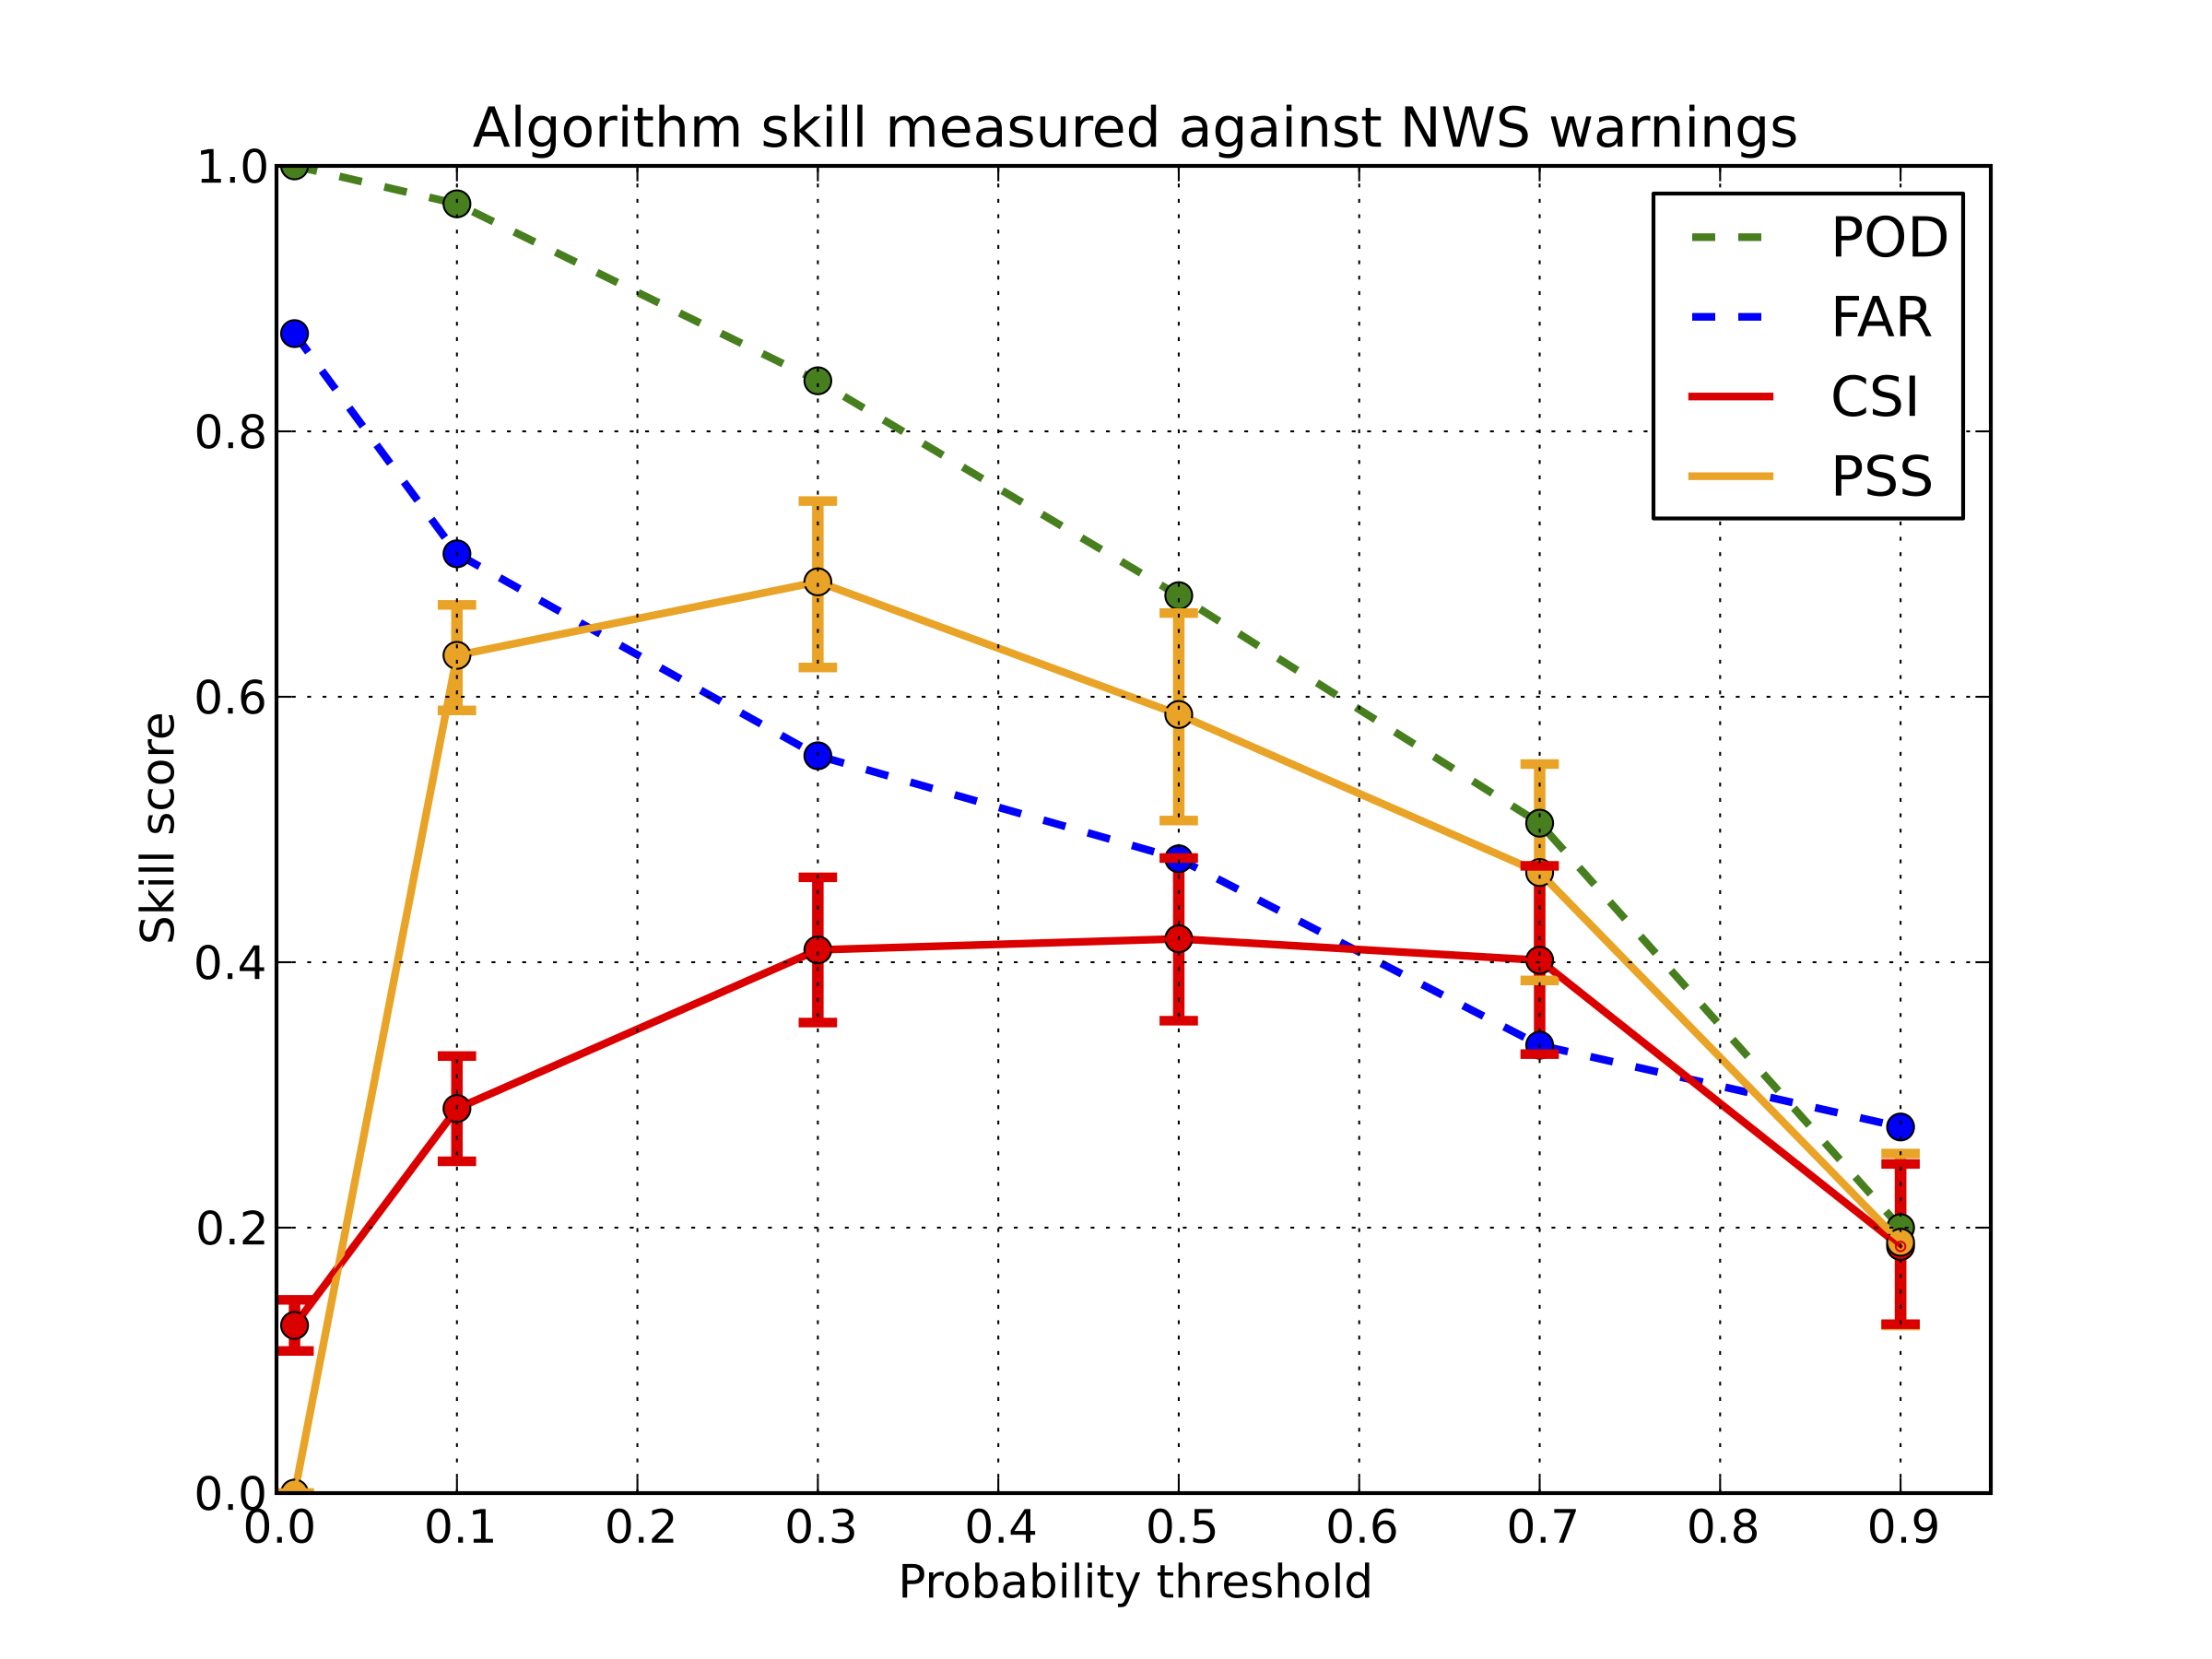
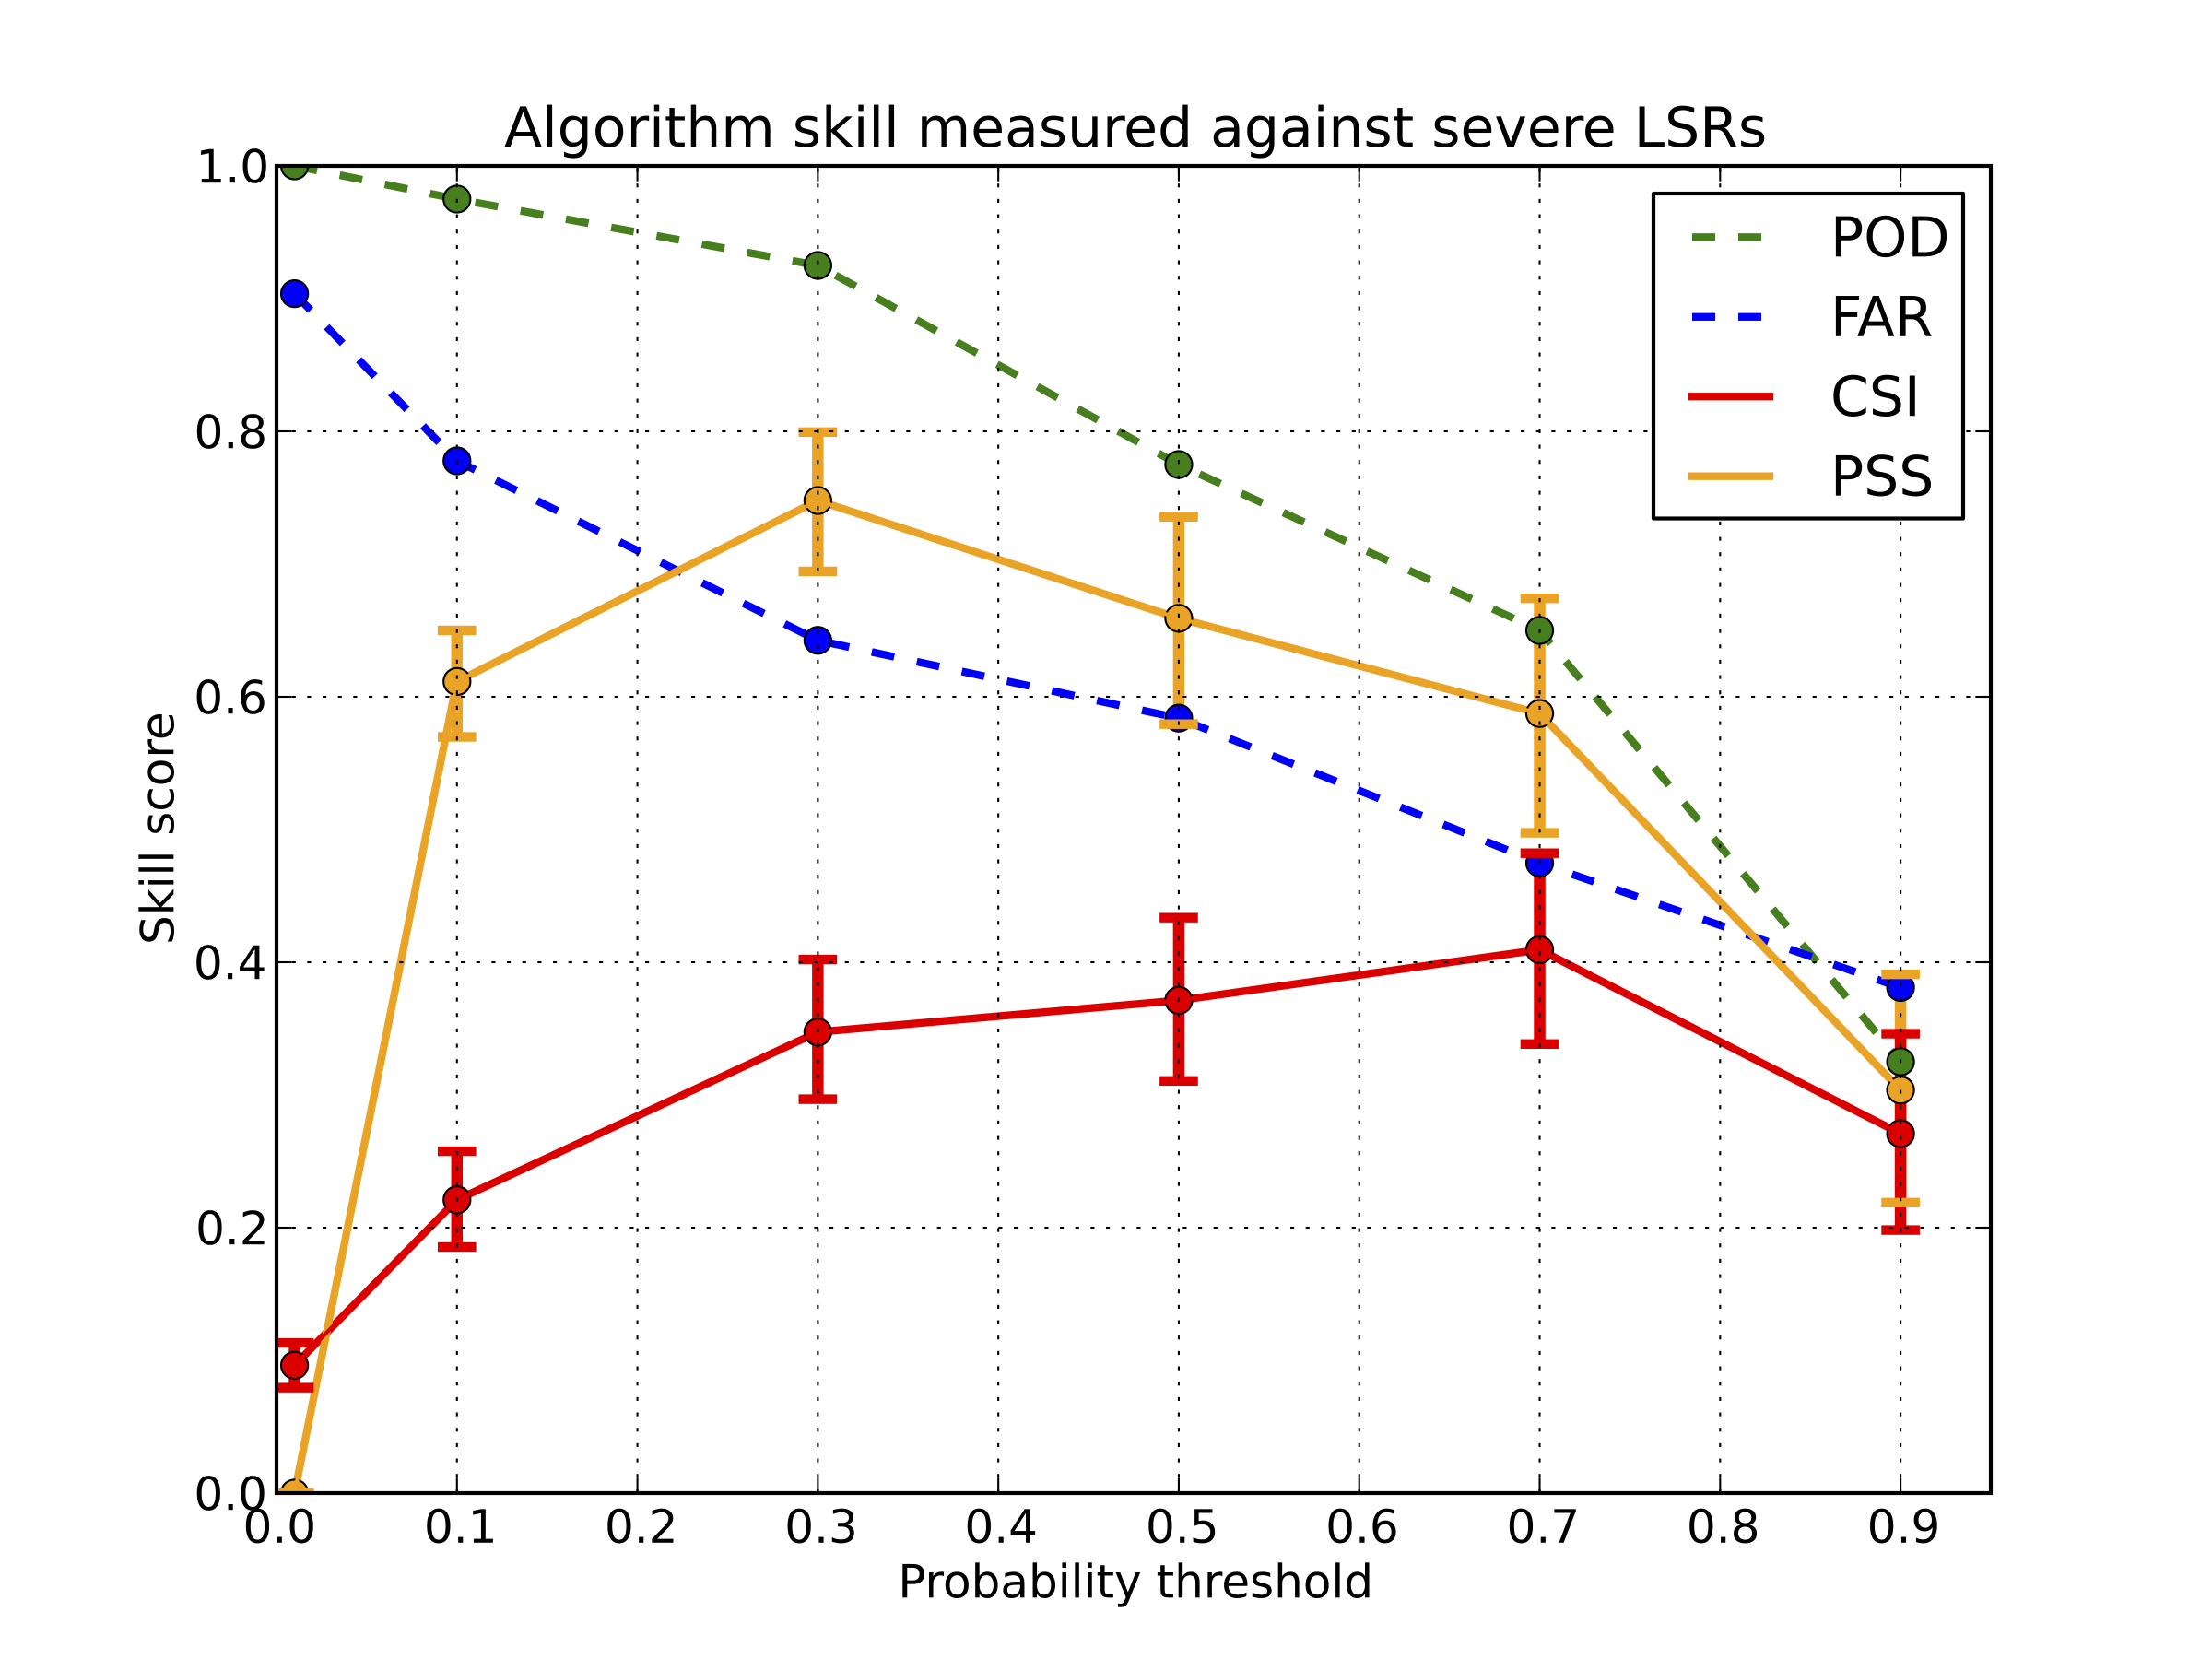
Skill was measured for multiple probability bins, thresholded at 1%, 10%, 30%, 50%, 70%, and 90%. POD, FAR, CSI, and PSS were calculated for the model, measured against initial NWS SVR and TOR warnings for storms (whichever came first) for the left figure, and initial LSRs for the right figure. When measured against NWS warnings, the maximum CSI was about 0.42 at the 50% threshold; there was a broad maximum of CSI of about 0.40 from 30% to 70% probabilities, however. The bars around each point on the CSI and PSS curves represent 95% confidence intervals for those values (obtained via statistical bootstrapping).
When measured against initial LSRs, the maximum CSI was about 0.40 at the 70% probability threshold. The POD is higher for 30% to 90% thresholds when measured against LSRs as opposed to NWS warnings, since NWS warnings typically (but not always) are issued prior to severe weather occurrence.
 |
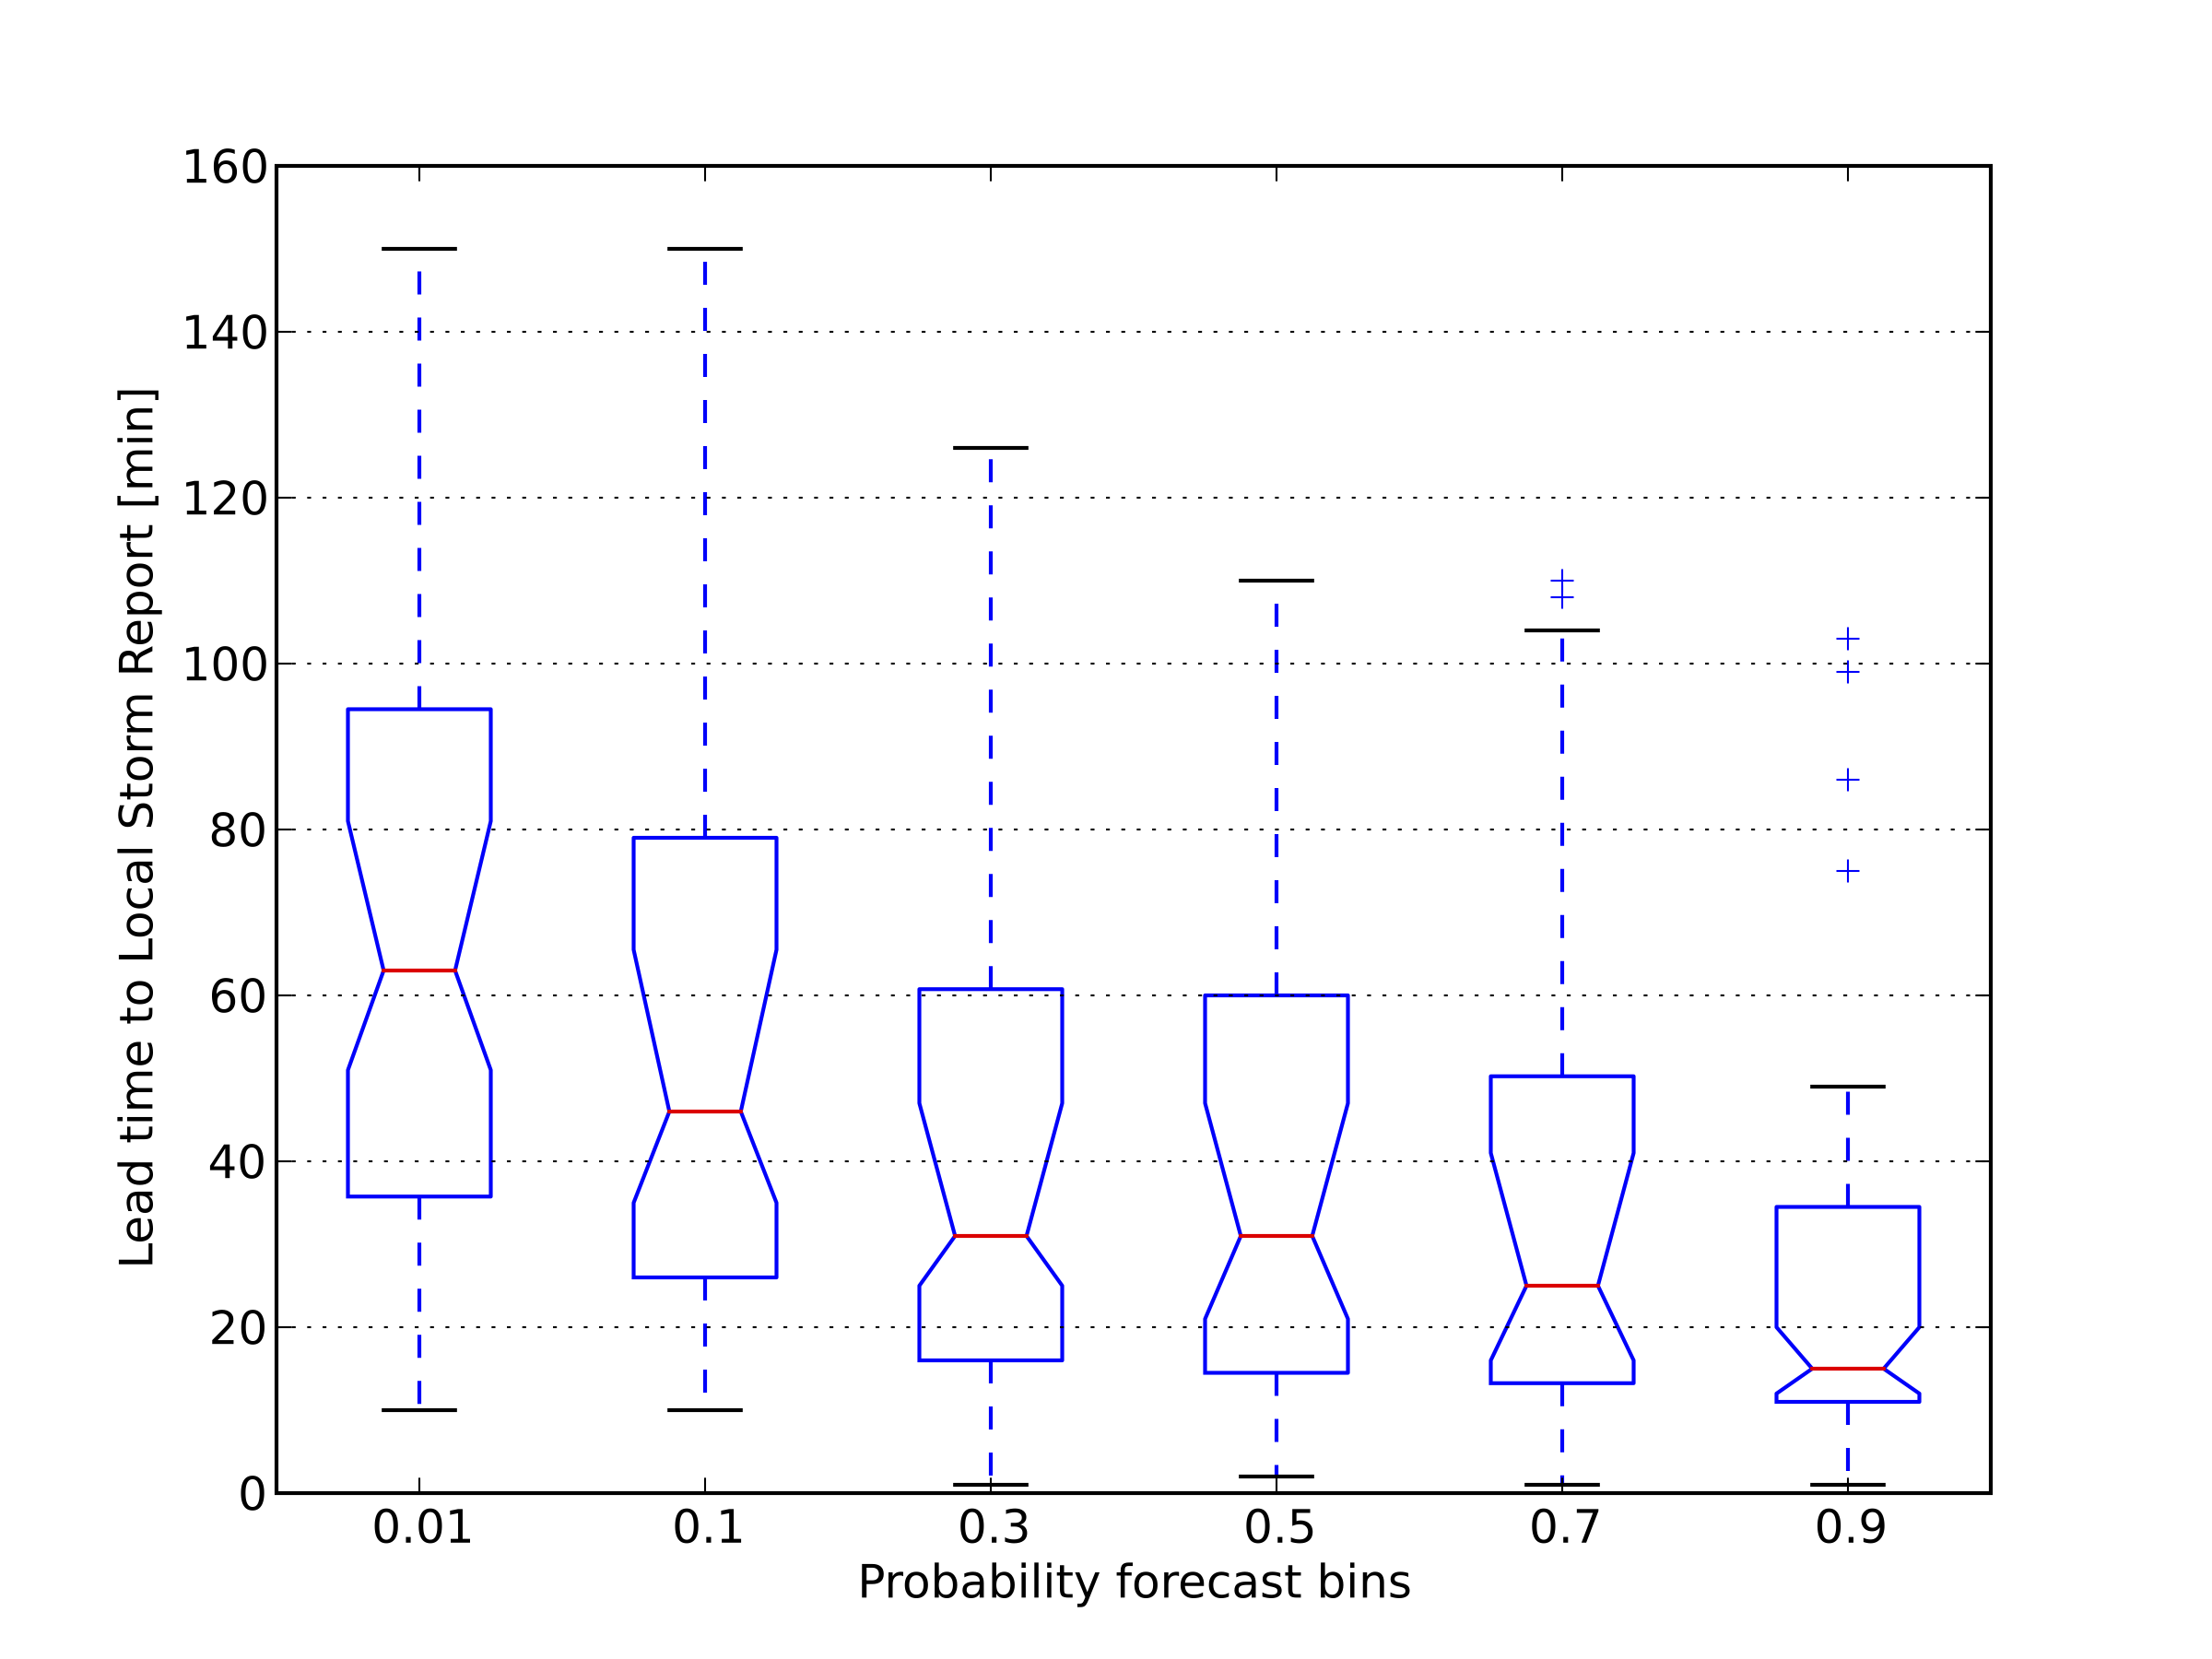 |
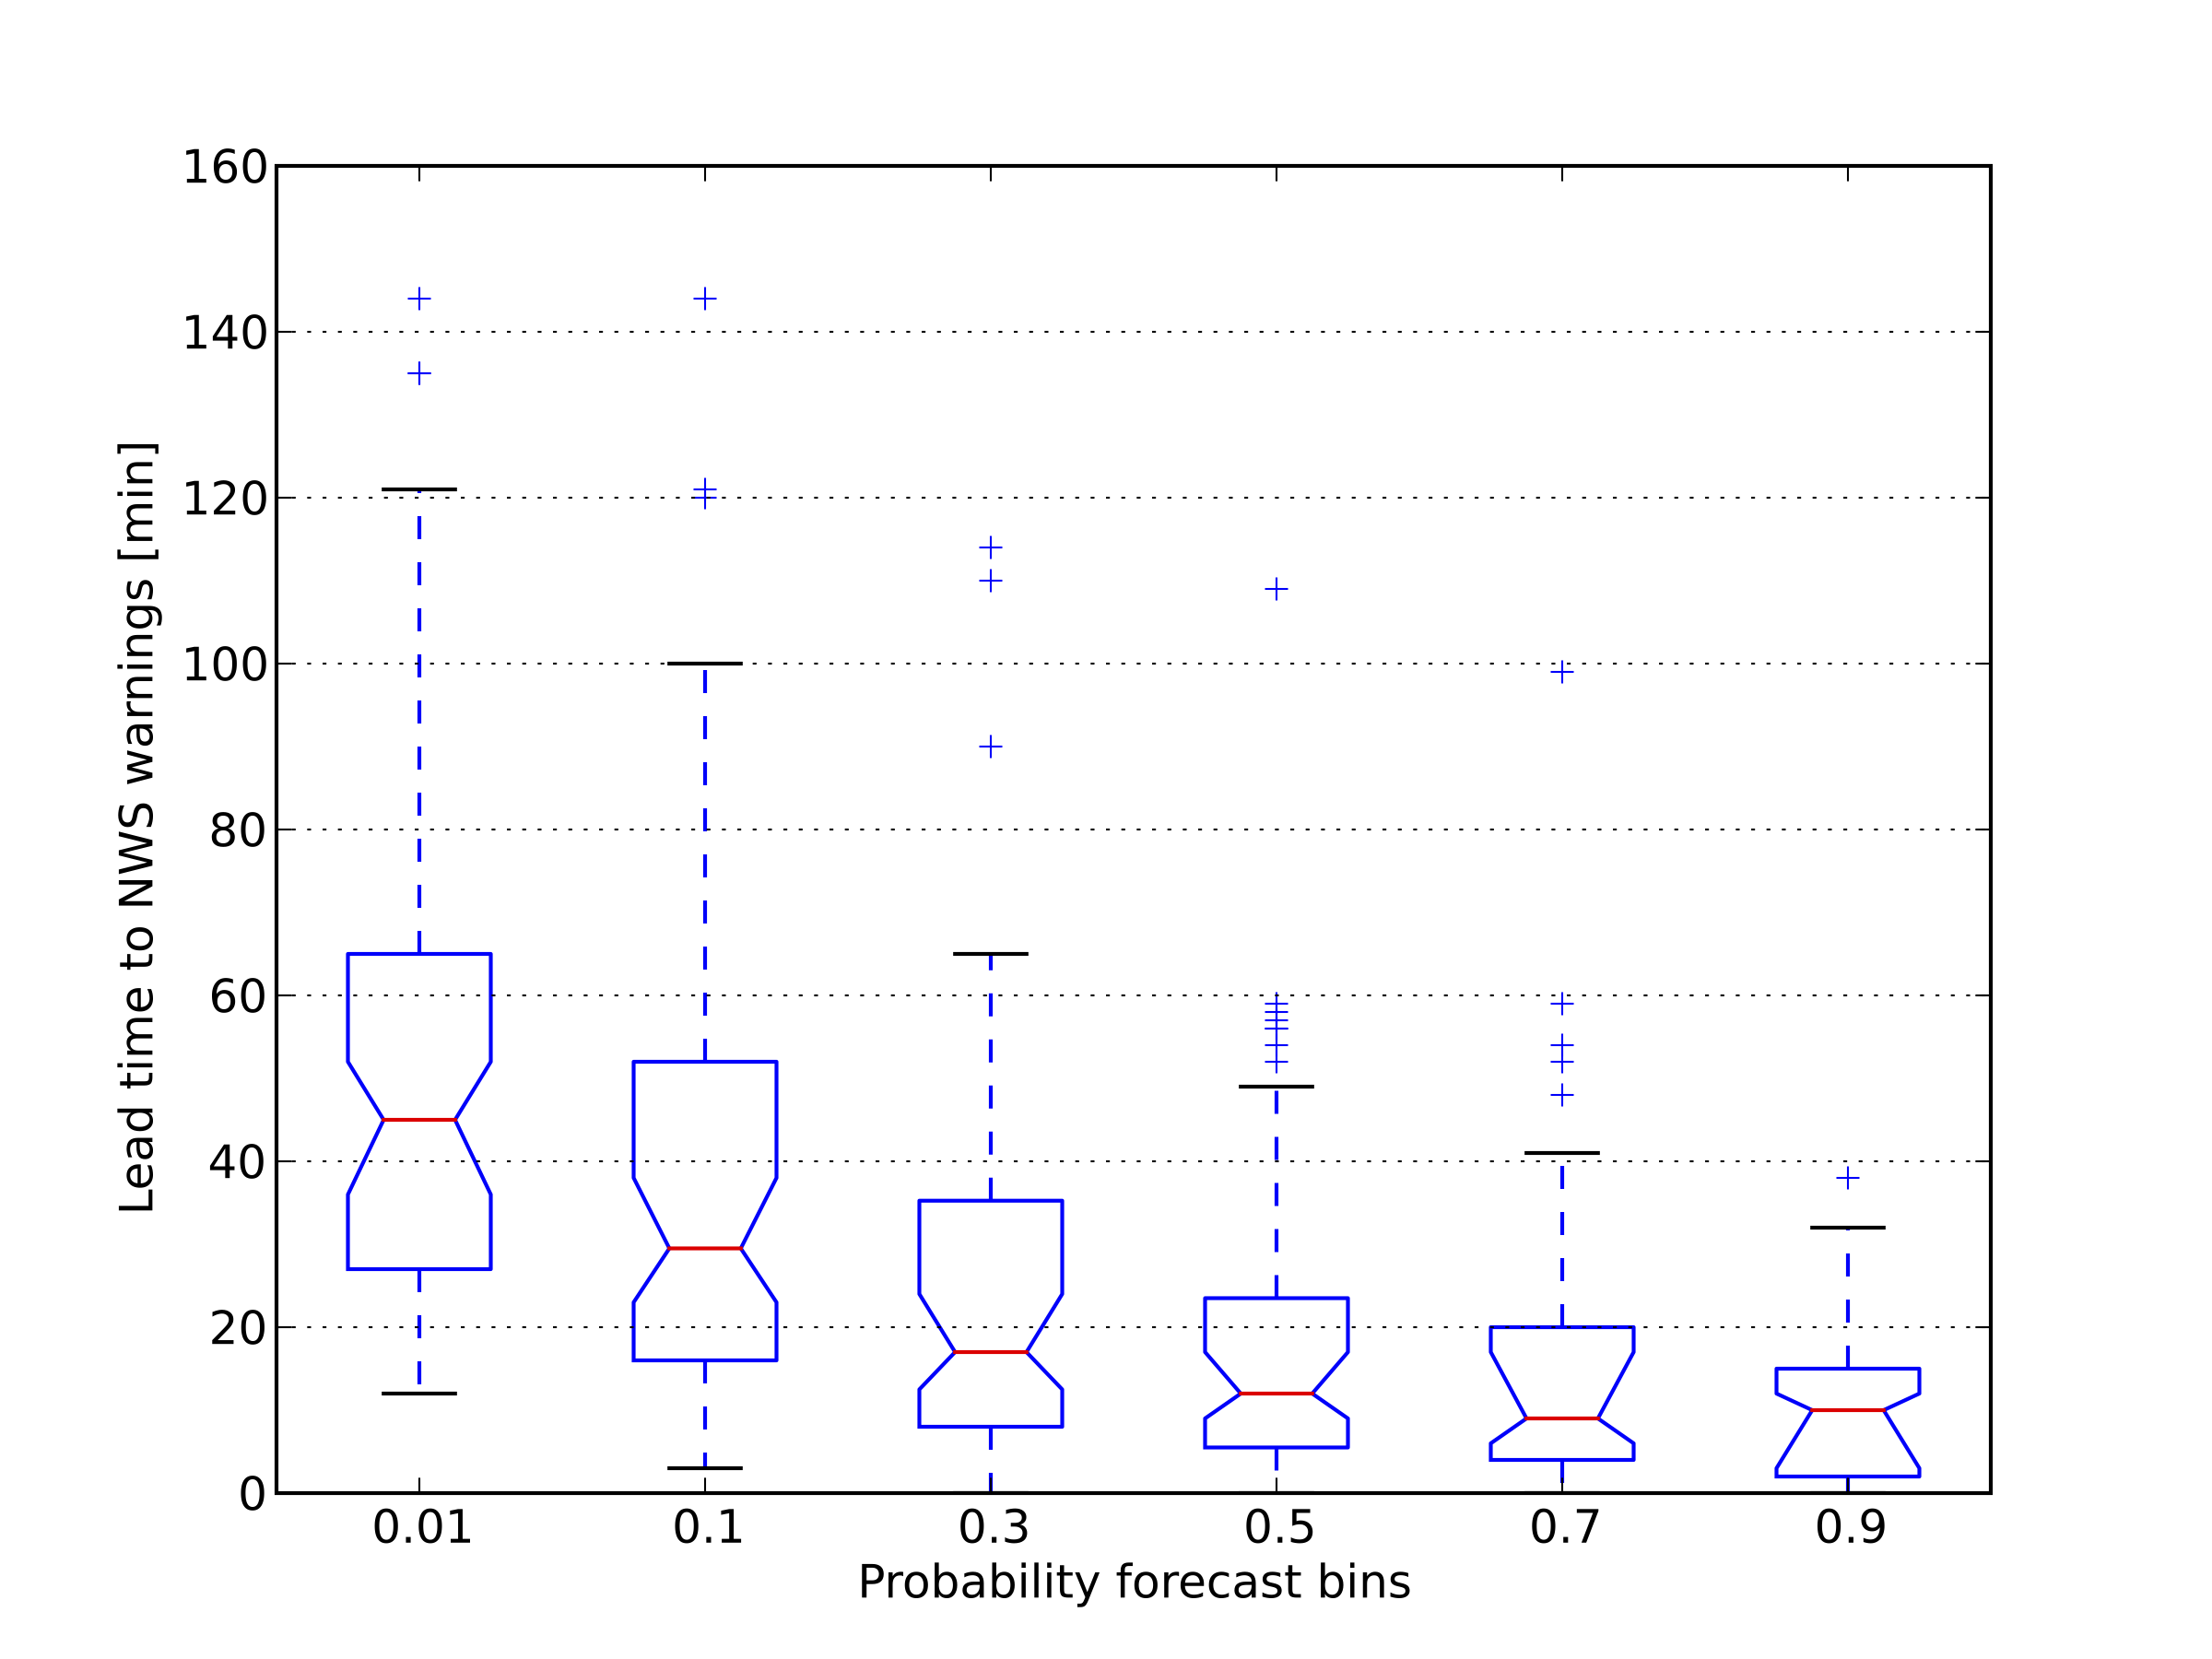
Lead time was measured for the ProbSevere model "hits", which are in this case, obtaining a certain probability threshold prior to initial NWS warning issuance (left figure), or LSR occurrence (right figure). Median lead times are represented by the horizontal red lines. Notches on the boxes represent 95% confidence intervals of the median lead time. The top and bottom edges of the box represent the interquartile range (IQR, 25th percentile to 75th percentile). The black horizontal lines, or "whiskers", are the last lead time point within +/- 1.5*IQR. Plus signs ("+") represent points outside +/- 1.5*IQR, or "outliers". We see that even at higher probability thresholds (50% to 90%), median lead times are in the 9 to 13 minute range prior to initial NWS warning issuance.
When lead time is measured prior to LSR occurrence (right figure), median lead time exceeds 30 minutes at the 30% and 50% thresholds, exceeds 20 minutes at the 70% threshold, and exceeds 15 minutes at the 90% threshold.
 |
 |
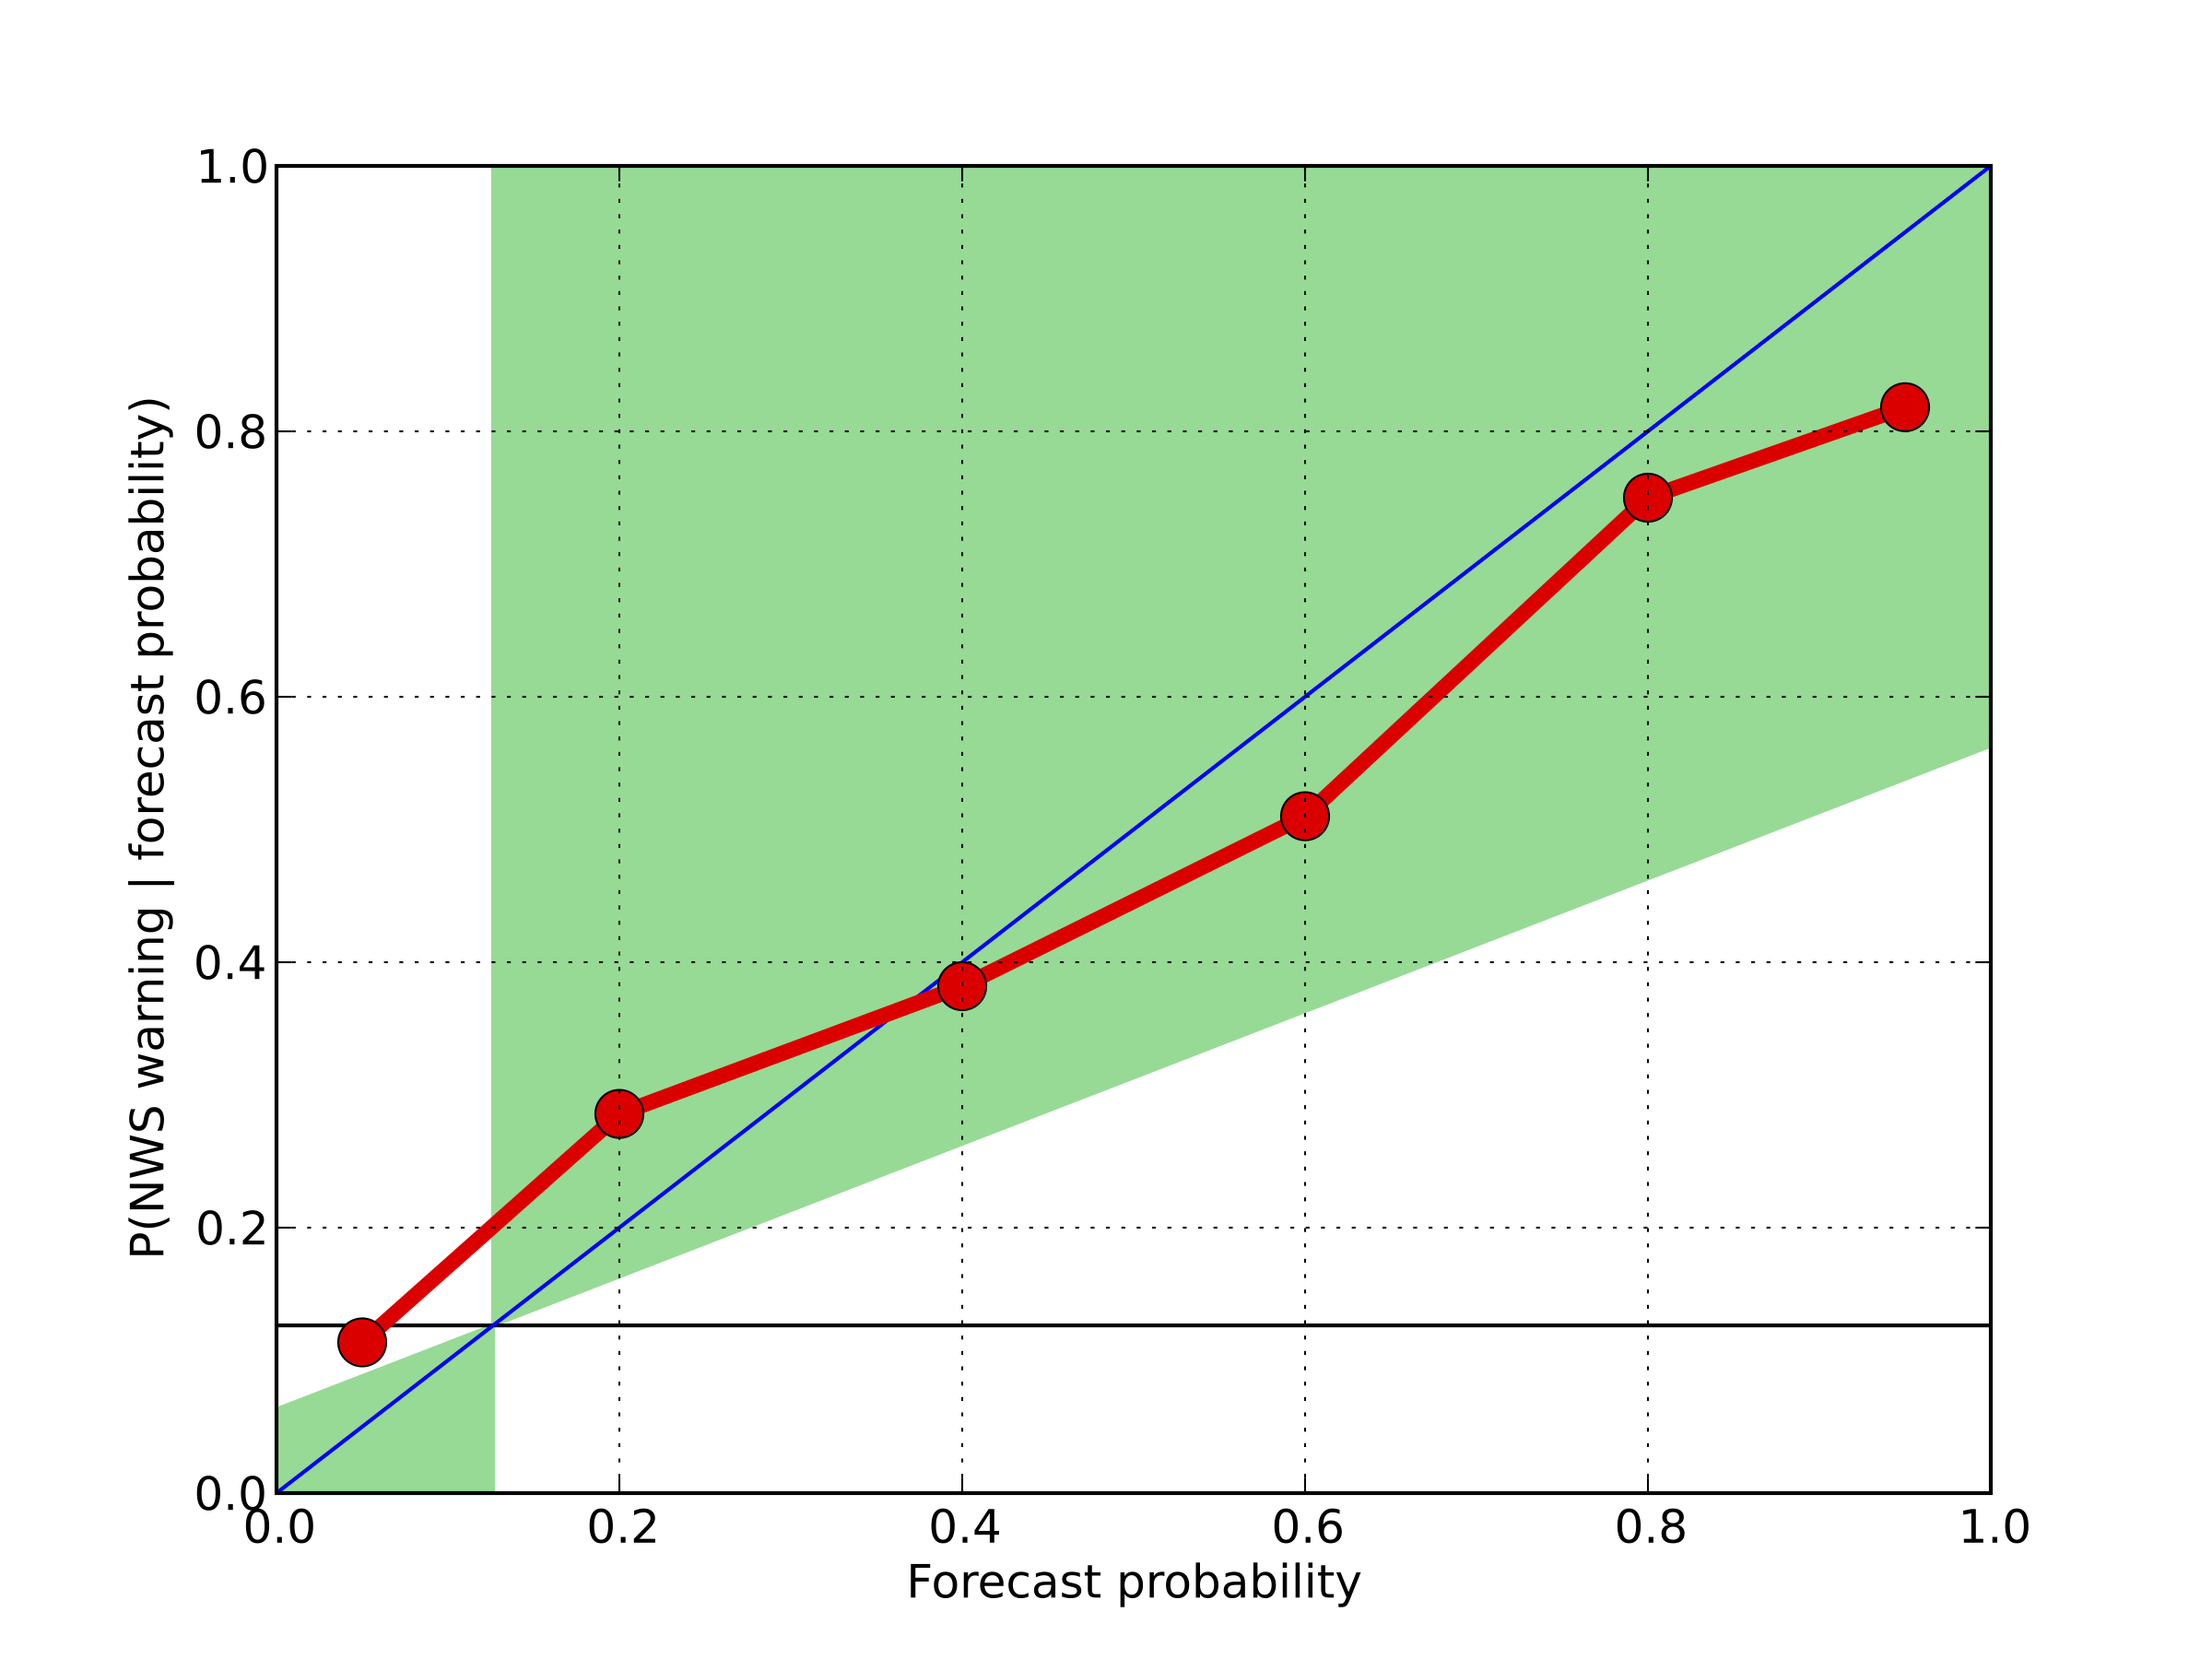
These are a "reliability" or "attributes" diagrams. They measure how well-calibrated the model probabilites actually are (e.g., when the model forecasts a 60% probabilty of severe, does severe weather occur 60% of the time?, or do the probabilities mean what they say?). The forecast probabilities on the x-axis represent the midpoints of the probability bins chosen. Anywhere a red point falls in the shaded green region represents that probability bin contributing positively to the skill (measured against the sample climatology). The left figure plots model reliability measured to initial NWS warning issuance for storms. The frequency of NWS warning issuance is about 12% for our sample, which is the horizontal black line toward the bottom of the plot. The diagonal blue line is the 1:1 line, and represents "perfect reliability". The closer the red points are to this line, the more reliable or well-calibrated the model is. You can see that most probability bins contribute positively to the model skill, and that the model is quite reliable overall, when measured against initial NWS warnings.
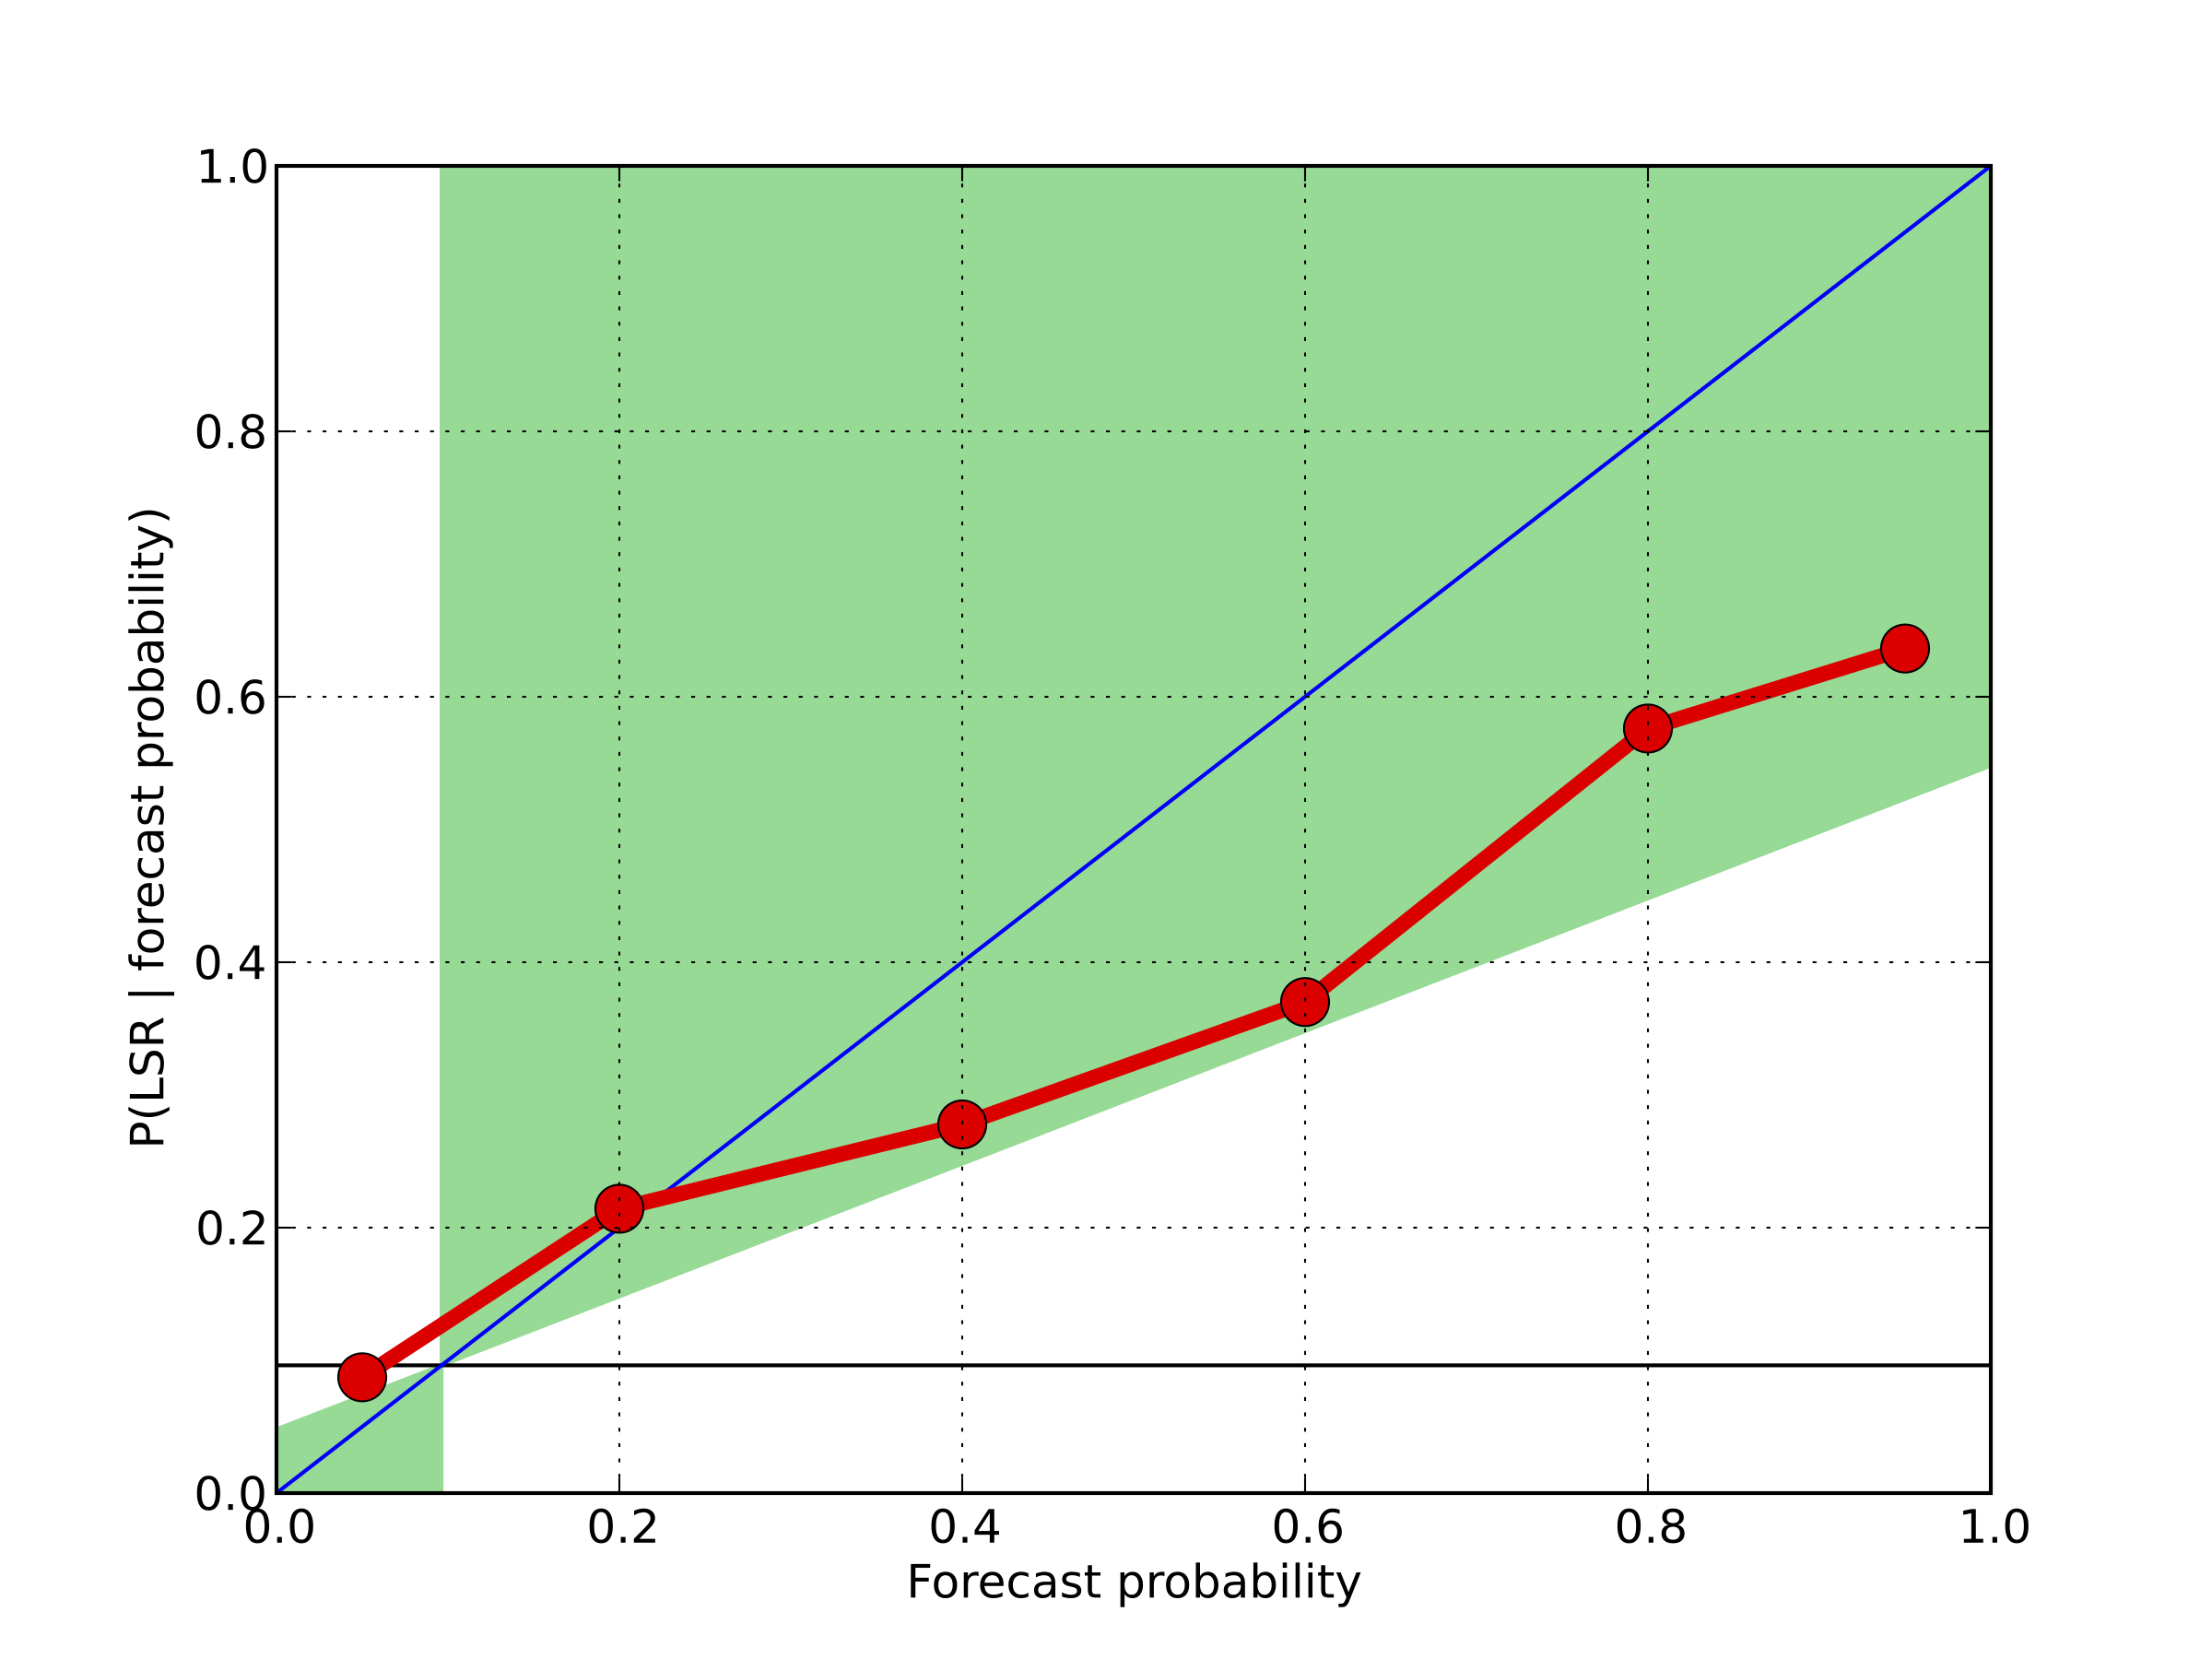
The figure on the right plots model reliability measured against LSR occurrence. The sample frequency for LSR occurrence is 9%. The model is still skillful at most probability bins, but seems to exhibit an overforecasting bias (i.e., LSR occurrence is less than what the model's forecasted probabilities are). Part of this may be due to inaccuracies in LSR reporting, but part of this may also be due to inaccuracies in the model as a result of many uncertainties and sources of error in the input data.