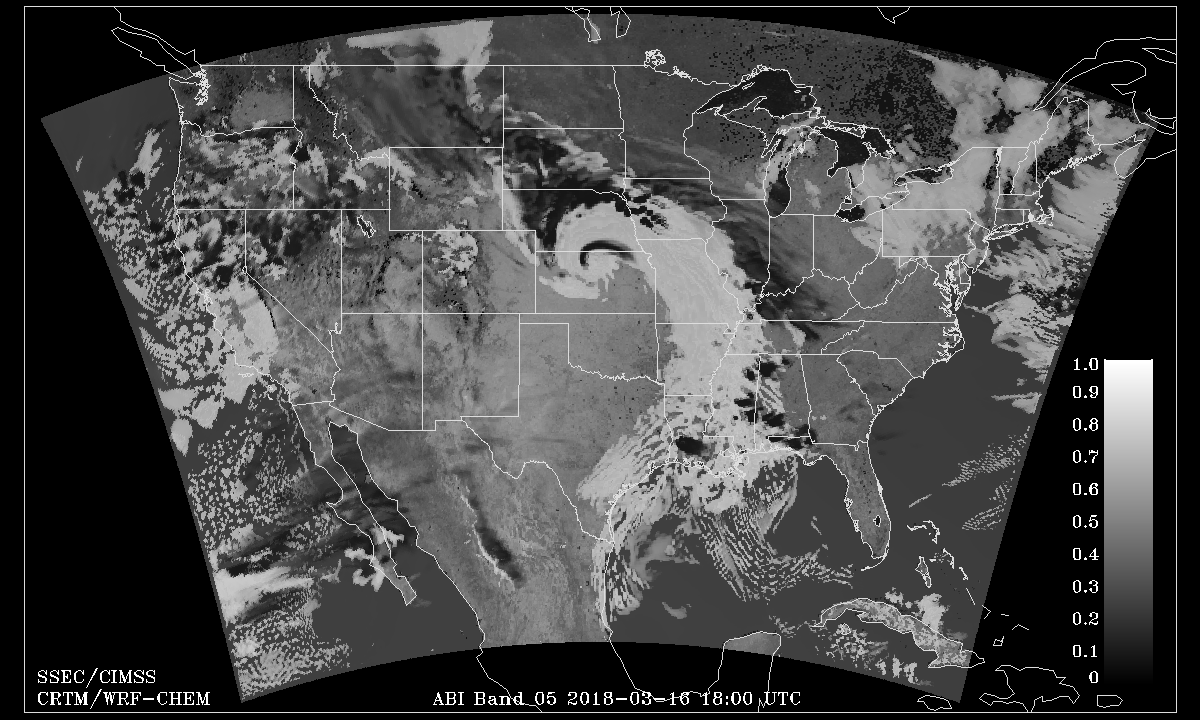
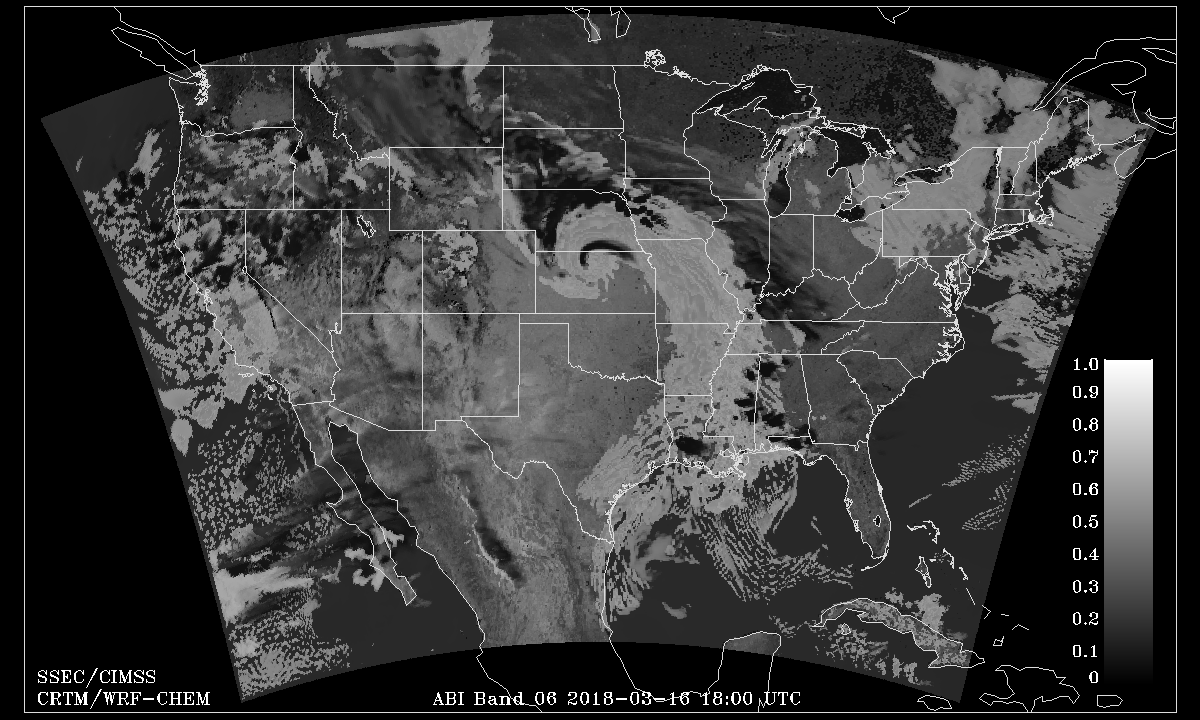
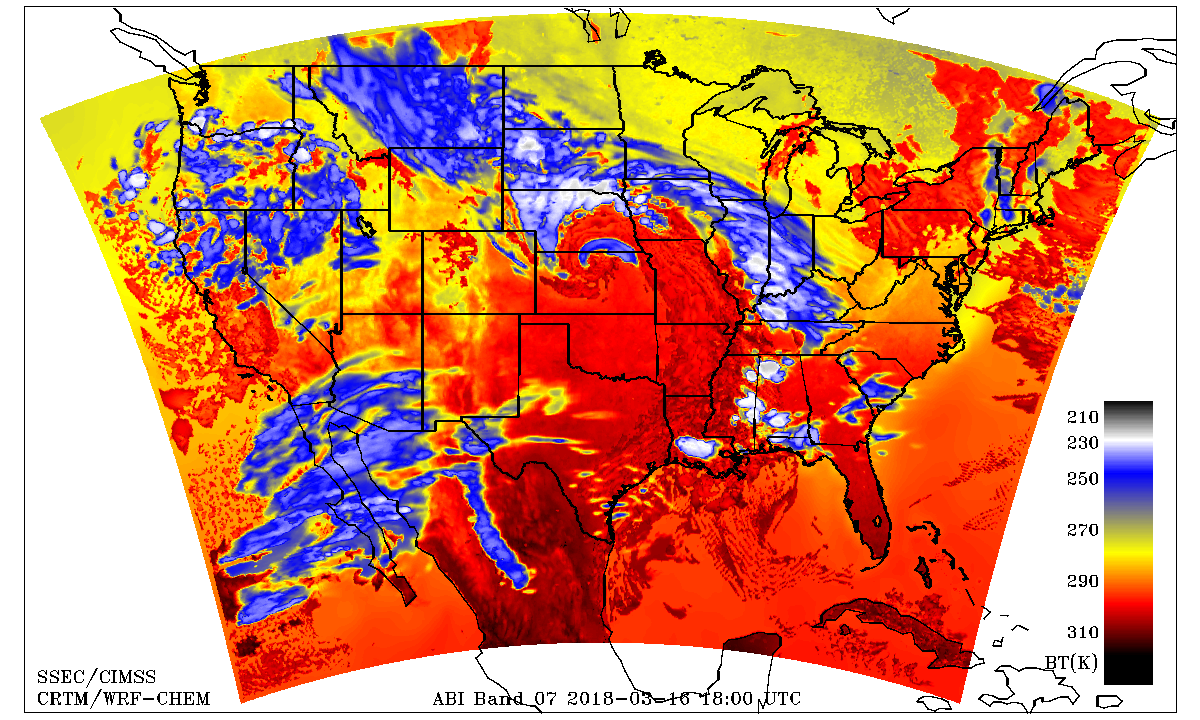
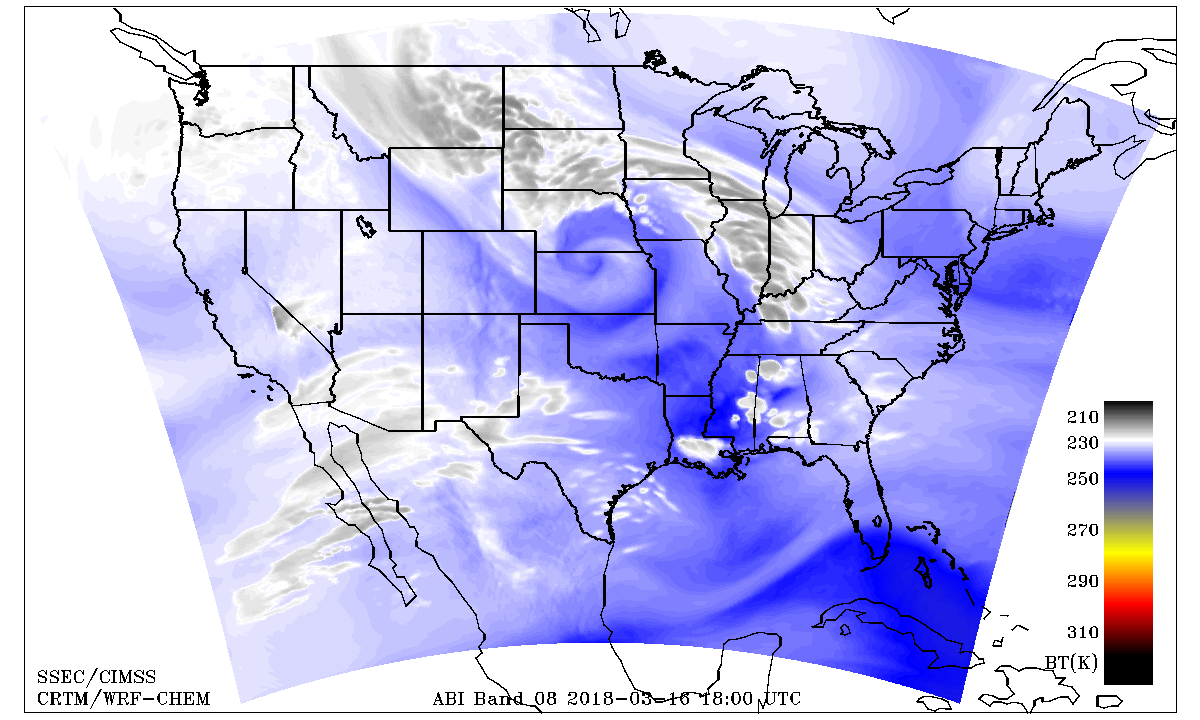
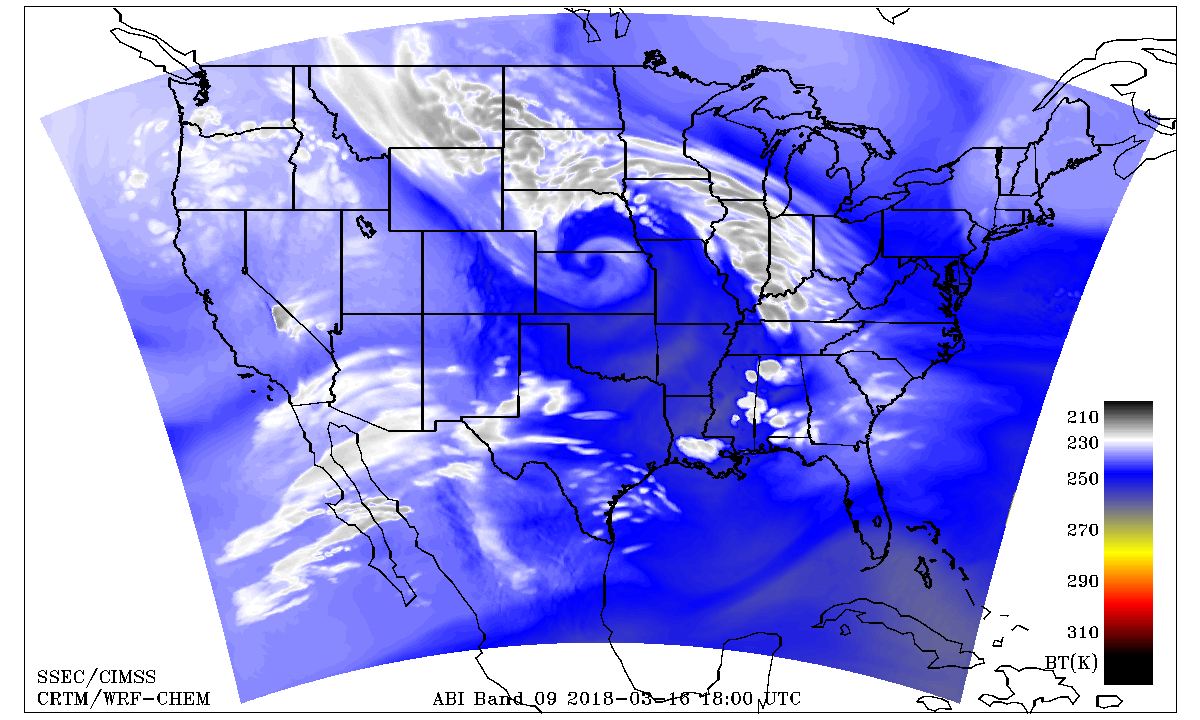
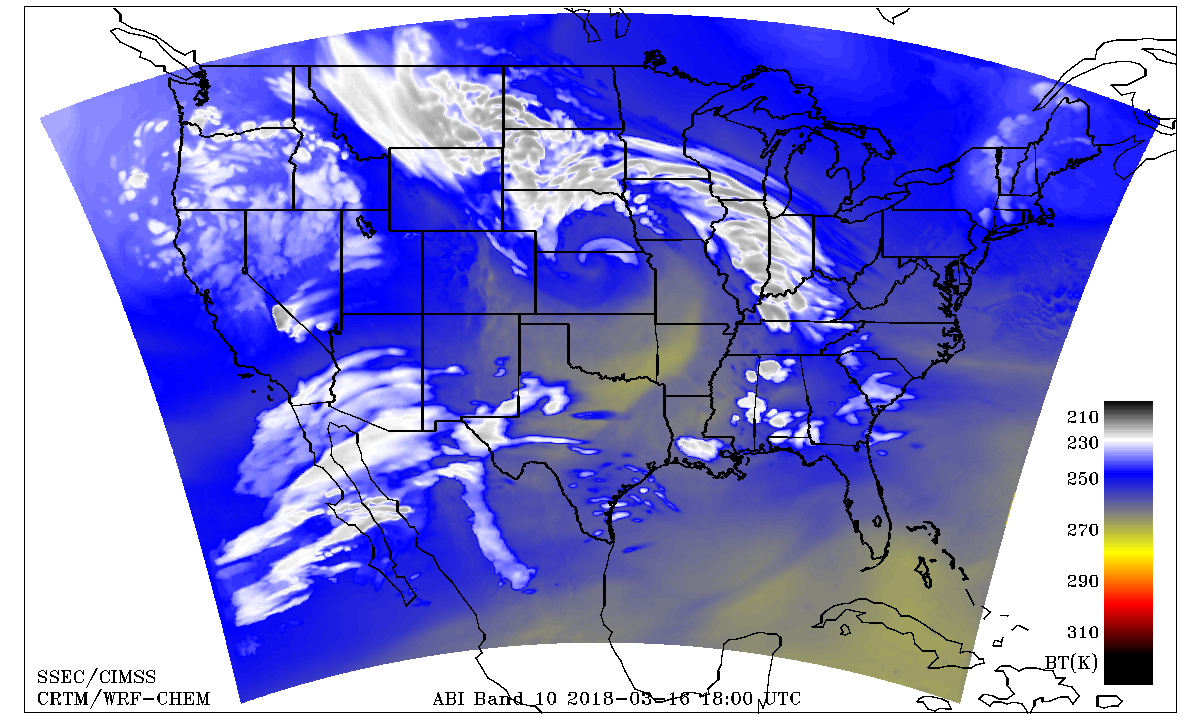
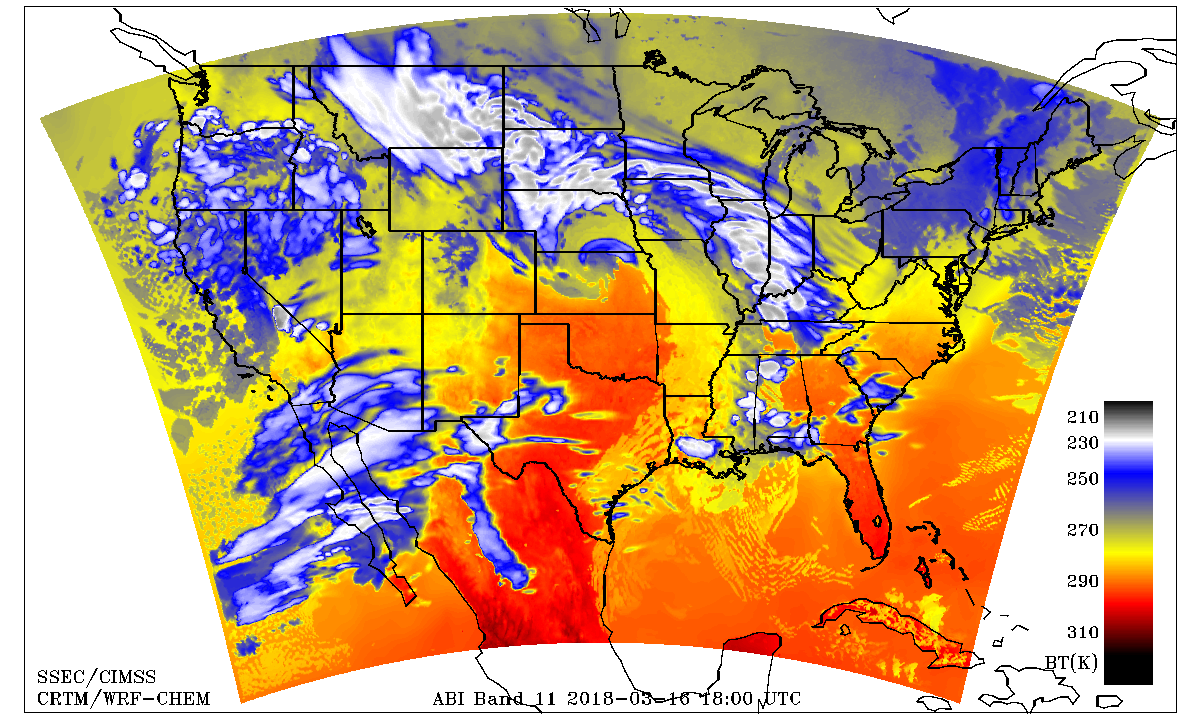
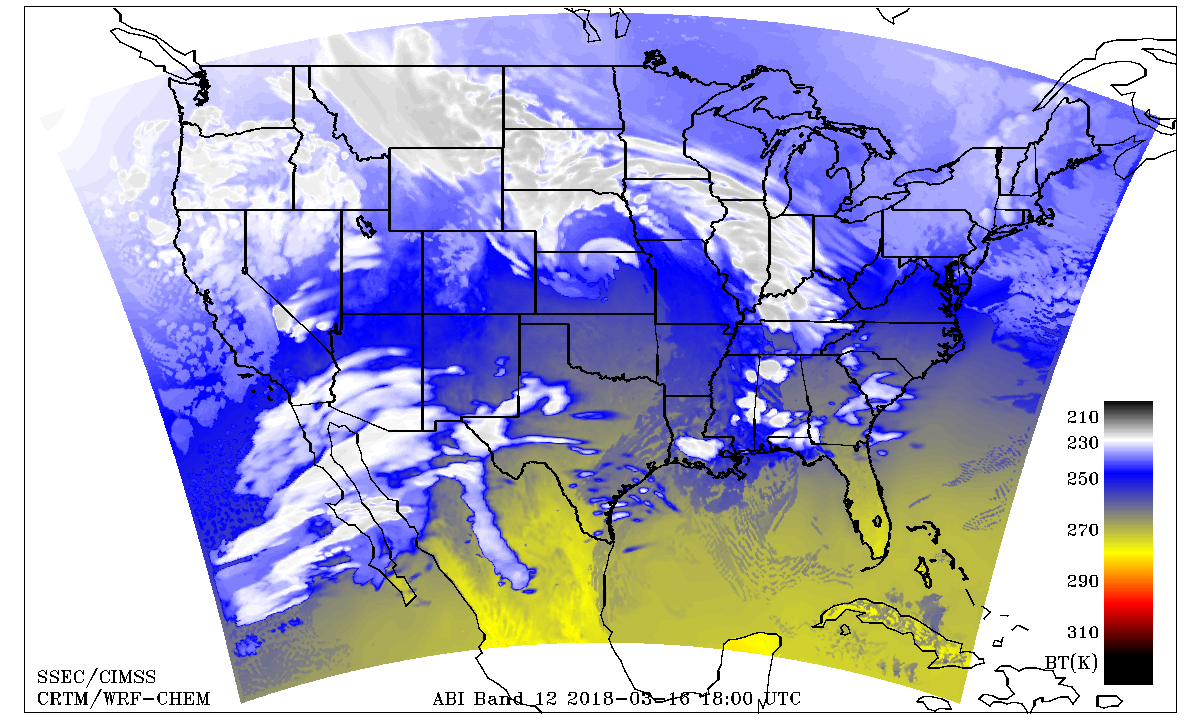
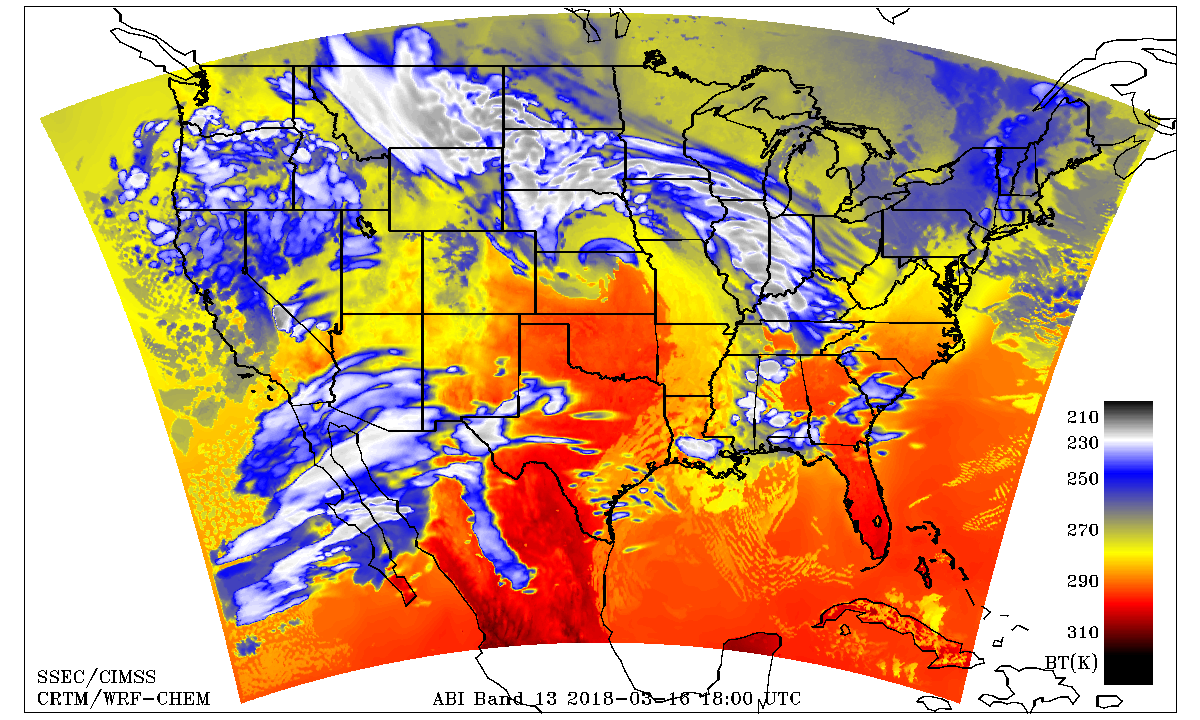
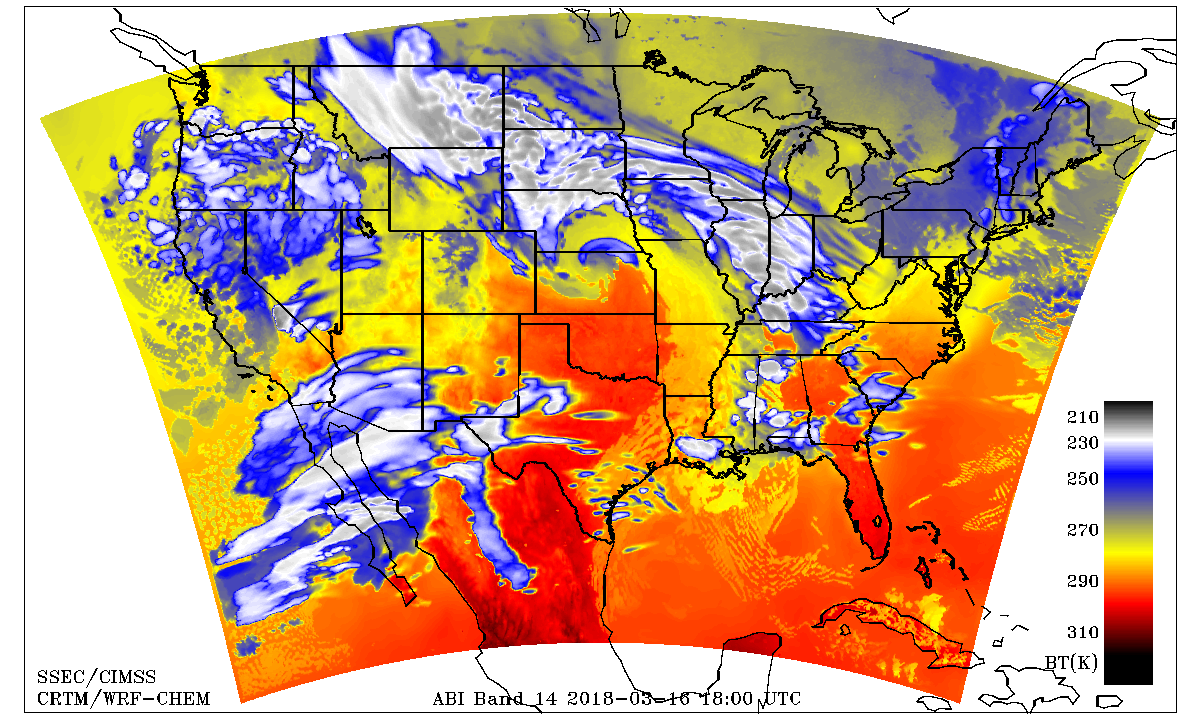
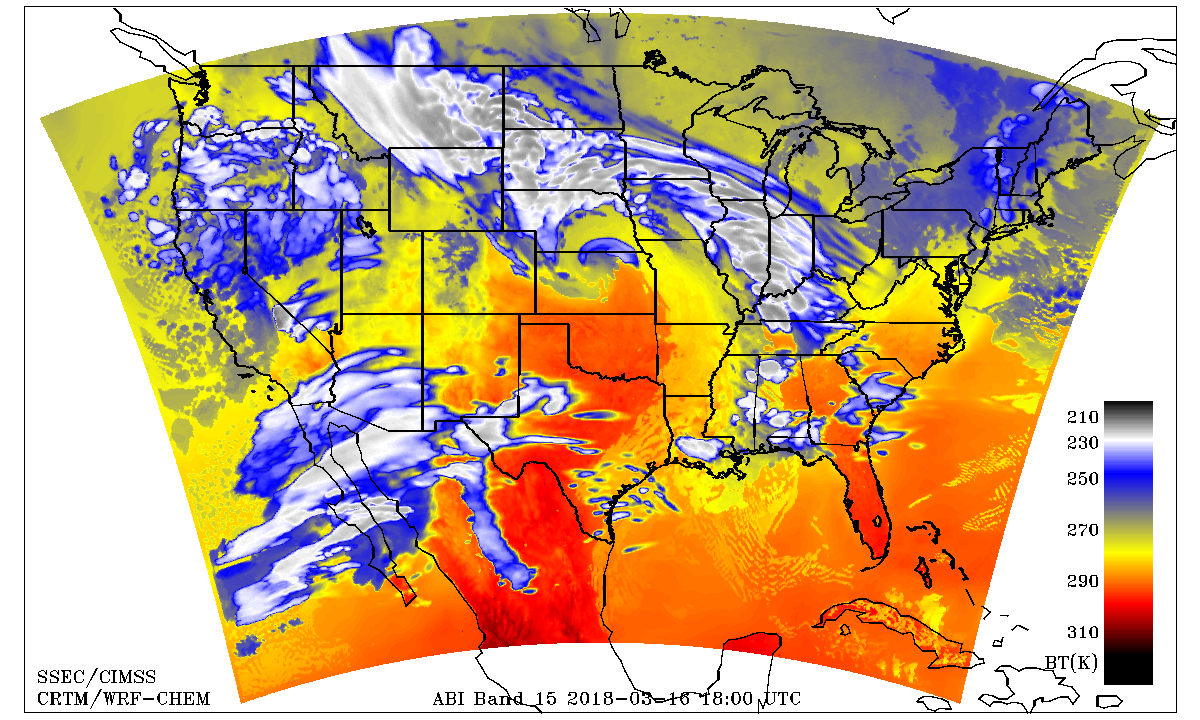
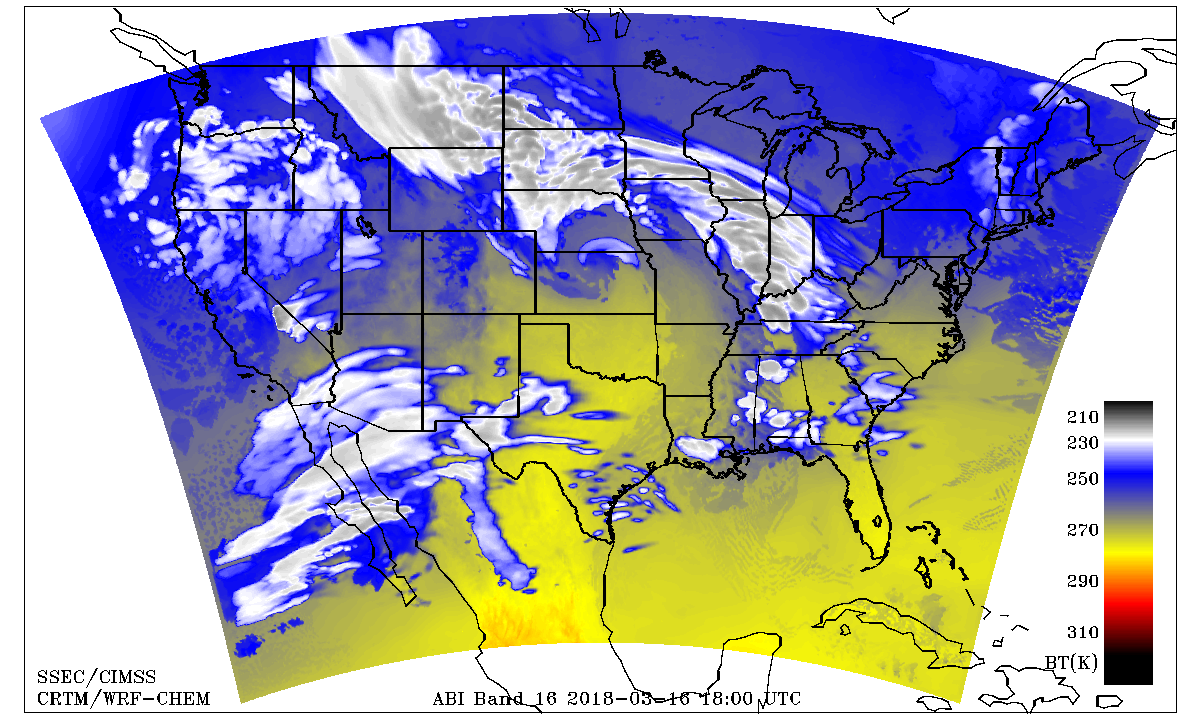
GOES-R Proving Ground UW/CIMSS WRF Chem Simulated ABI Bands 1-16
Click on band for time loop. |
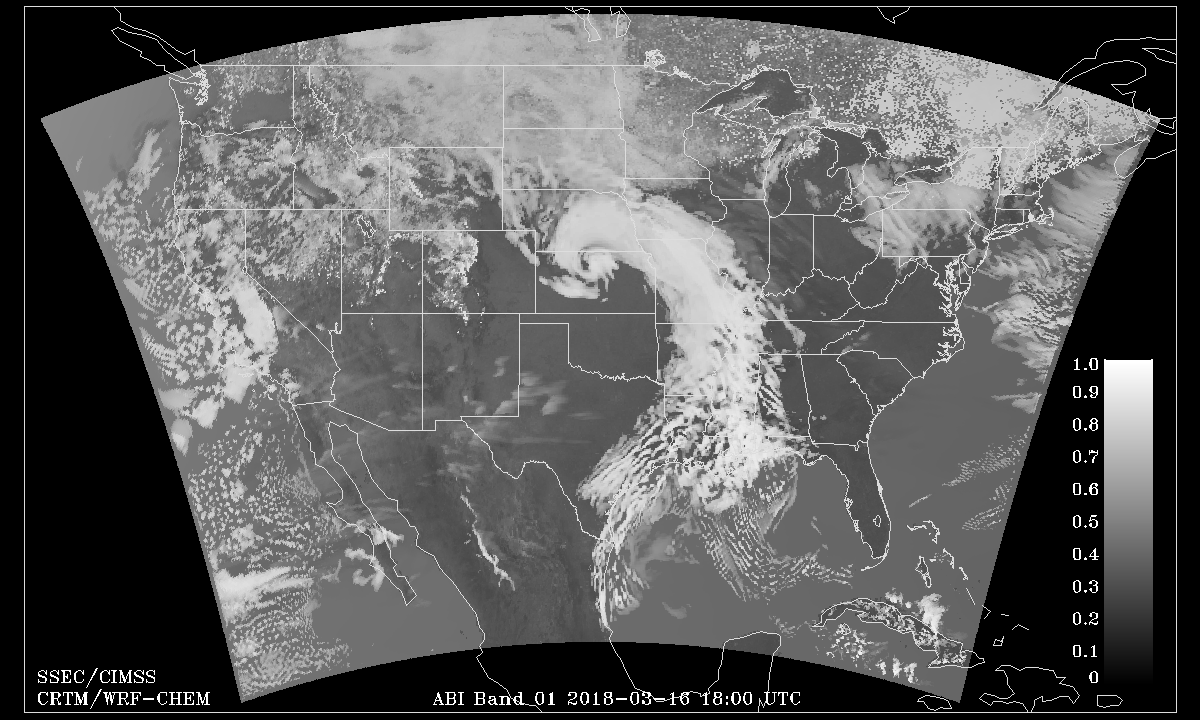
Simulated Radiance Details: The above simulated radiances are computed in several steps. First, a 36 hour forecast is produced over CONUS using WRF/Chem V3.3.1 (Grell et al., 2005) with the Goddard Chemistry Aerosol Radiation and Transport (GOCART) aerosol scheme (Chin et al., 2000, 2002) run at 8 km horizontal resolution with 34 vertical layers. Meteorological initial conditions and LBCs are provided from NCEP GFS forecasts. Aerosol initial conditions and LBCs are obtained from the Realtime Air Quality Modeling System (RAQMS; Pierce et al., 2007) 1x1 degree global forecasts run daily at CIMSS. The WRF/Chem forecasts use high resolution continental US anthropogenic aerosol and ozone precursor emissions based upon the U.S. EPA's 2005 National Emissions Inventory (NEI-2005). The forecasts also include biomass burning emissions from the preceding day produced from Wild Fire Automated Biomass Burning Algorithm (WFABBA) wildfire products and WRF/Chem biomass burning emissions software.
Output from the last 24 hours of the WRF/Chem forecasts is used to construct hourly ABI top of the atmosphere radiances for all 16 ABI bands at model grid points using the NOAA Community Radiative Transfer Model (CRTM, Han et al., 2006). V2.1 forward model and appropriate satellite viewing geometry. Since ozone is not predicted by the version of WRF/Chem used herein, RAQMS ozone distributions are interpolated to the WRF/Chem horizontal and vertical grid. RAQMS data are also used to provide profiles of temperature and ozone above the top of WRF/Chem (50 mb) to 0.5 mb. These data are specified at the AIRS 100 pressure levels which reside above the top of WRF/Chem.
User defined land surface emissivity for the 10 ABI IR bands is obtained by convolving the high spectral resolution University of Wisconsin (UW) Baseline Fit (BF) emissivity database with the ABI spectral response functions. Land surface reflectivity for the 6 ABI Visible/NIR bands is obtained using MODIS Bi-directional MODIS BRDF/albedo products produced at the UW-Madison Space Science and Engineering Center using Direct Broadcast data.