The Space Science and Engineering Center,
at the University of Wisconsin-Madison, runs a research forecast model,
the
Cooperative Institute for Meteorological Satellite Studies (CIMSS)
Regional
Assimilation System (CRAS), that outputs
forecast
products including satellite Imagery.
Numerical modelers can use CRAS satellite forecasts as explicit
confirmation that satellite data validation offers an accurate and
precise tool
for not only global forecasting interests, but also for specific NASA
purposes,
for instance, assessing weather conditions prior to shuttle
launching.
Furthermore, NASA public releases include the
importance of satellite data in numerical models, such as improved
three-day
ocean condition forecasts (www.nasa.gov,
2006).
Unlike previous comparisons, 2005-2006 research used GOES Sounder data as the validating dataset against CRAS satellite forecasts in response to discovering the CRAS only assimilated Sounder data. Therefore, 2004-2005 statistical results offered a transverse substantiation of CRAS satellite forecasts, as the contingent GOES dataset was of derived Imager products. Accordingly, while 2004-2005 qualitative findings were appropriate, any quantitative arguments must be considered with some degree of leniency.
Recent forecasting skill measurements also accounted for the mismatch of spatial scales between the model grid data and observations. A smoothing technique, combined with extrapolating cloud-to-surface comparisons from the overall statistical results, as offered with a Sounder dataset, facilitated the validation of the 12hr 12Z (7am CDT) CRAS simulation of the 13 April 2006 tornado and large hail outbreak in Iowa and Wisconsin. This particular case was chosen, out of a number of events, due to its composition of both synoptic-scale (large-scale) and mesoscale (small-scale) attributes. Qualitative assessment elucidated that the CRAS forecasted too much cloud cover, and the clouds produced were warmer than what observations suggest. Quantitative results complemented qualitative assessments. Root Mean Square (RMS) errors generated were lower than those from 2004-2005; and, as expected, increased with each 03 hourly forecast. Additionally, the acknowledged extent of warmer clouds was seen in a grid-to-grid enumeration, indicating a small positive CTT bias. RMS errors could have been reduced should the CRAS have constructed overall thicker cloud structures with resultant colder CTTs. Overall better statistical results, in comparison to 2004-2005, were still expected due to the techniques used to eliminate cloud-to-surface comparisons.
For
a
comprehensive, heuristic evolution of the 13 April 2006 event, vis5d, a
3-D
visualization software package, files were generated.
Vis5d files were then used in an innovative,
user-friendly meteorological tool, Integrated Data Viewer (IDV), to
expedite a
comprehensive 3-D analysis of cloud structures and corresponding
precipitation
patterns. Using IDV demonstrated that
the CRAS accurately initiated and prognosed the convective cell that
would drop
an F-2 tornado on Iowa City, Iowa;
and, in conjunction, the multitude of cells that would drop 4.25in
hailstones
across many southern Wisconsin communities (National Weather Service –
Milwaukee, 2006).
II. Data
All research data and applications were created and provided by CIMSS, located on the University of Wisconsin – Madison campus. CIMSS supplied realtime GOES Imager and Sounder data. 11um (infrared) Imager data was available on a consistent basis at fifteen-minute intervals, with spatial resolution at approximately 5km over the continental United Sates (CONUS). While Imager provided fine-scale resolution, the amount of observed radiance made for noisy data. 11um Sounder data was available at hourly intervals, at a more course, 10km resolution. The narrow spectral width of the satellite instrument settled the noise discrepancy offered by Imager data (Schreiner, 2006).
The CRAS model was simulated in an Euerlian fashion; thus, equations of motion and atmospheric physical formulations were calculated at fixed grid points. Recent changes in the CRAS included the addition of six atmospheric levels to a predesigned atmosphere composed of thirty-two vertical layers (Aune, 2006). Running at 60km horizontal resolution, the CRAS also incorporated a meshed 20km Midwest domain (Fig. 1). The latter domain was chosen as the focus of this research project due to the encompassment of Wisconsin within its bounds. Four-panel plots, over the 20km domain, comparing CRAS satellite forecasts (top) to actual GOES Imagery (bottom), were created by National Oceanic Atmospheric Administration/ National Environmental Satellite Data and Information Service (NOAA/NESDIS) employee, Gary Wade. Wade also devised a satellite image color enhancement to aid in qualitative comparisons of CRAS forecasted Imagery to reality as observed by GOES. All quantitative measurements and presented statistics were calculated with a statistical software package, xsau5, created by NOAA/NESDIS employee, Robert Aune. Xsau5 permitted the computation of RMS errors, CTT means, and grid-to-grid biases.
Using xsau5, CRAS forecasted CTTs were compared against Sounder CTT observations. Unlike 2004-2005 investigations, cloud-to-surface comparisons were rejected by manually selecting a mask that would scrutinize any Sounder observations with Effective Cloud Amount (ECA) values of less than twenty-five percent. This threshold was selected due to its specific implementation in the CRAS model, where assimilated Sounder observations with ECA values of twenty-five percent or less denoted clear sky (Aune, 2006). Thus, a given Sounder observation dataset, composed of approximately twelve thousand observations, may be reduced to the four-to-seven-thousand range in accordance to the masking terminus.
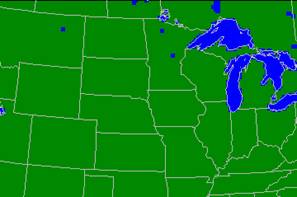
Figure 1. 20km nested grid for the central US in the 60km CRAS grid (Aune, 2006).
The CRAS only resolved, at best, 20km resolution cloud structures within a given 20km grid box. Since Sounder observations can actualize clouds to 10km resolution, then computed results would implicitly disfavor CRAS cloud forecasts. Furthermore, CRAS clouds are produced in gridspace; consequently, Sounder observations were co-located and then smoothed with a Cressman smoothing technique to best fit gridspace projections. Conclusively, a grid-to-grid comparison was conducted to omit grid-to-observation biases.
Vis5d files were also generated for a subset domain, within the 20km nest, over Minnesota, Iowa, Wisconsin, Upper Michigan, and northern Illinois. These files were uploaded in IDV and subsequent 3-D images and animations were originated to initiate a comprehensive 3-D understanding of the evolution of cloud formation and successive precipitation processes; 3-D cloud liquid water content [g/kg] and 3-D rain rates [g/kg] were analyzed.
III. 12Z 13 April – 00Z 14 April 2006 Validation
a) 12Z 13 April – Initialization:
While several cases have been conducted, the 13 April 2006 severe weather episode over the Upper Midwest encompassed a suite of desired comparable elements, including large-scale, synoptic features, with mesoscale convective (mesoconvective) components. Fig. 2 (top) delineated CRAS interpretation of 11um 20km central US cloud structures at initialization, incorporating assimilated GOES Sounder data, valid 12Z 13 April (~7am CDT). Fig. 2 (bottom) showed the actual GOES-12 satellite image with Wade enhancement valid at the same time.
Noteworthy was the extent of a large, synoptic ridging pattern over the Upper Midwest, extending into the western Great Lakes Region. Embedded within the ambient synoptic flow pattern was small-scale, mesoconvective features over west-central Minnesota and southeast North Dakota, with more widespread convective activity along the US-Canadian border. Qualitative assessment regarded initialization as credible, with the CRAS capturing the overall ridge pattern as validated by GOES-12. The placement of convective cells appeared acceptable, though the magnitude of cold CTTs was not entirely grasped by the model; for instance, various cold cloud tops were predicted too warm by the CRAS over North Dakota and north-central Minnesota.
A
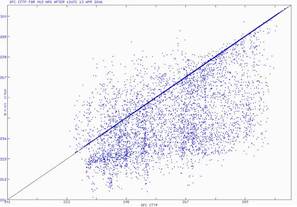
scatter plot (Fig. 3) and explicatory
statistical results were generated for initialization.
As anticipated, CRAS CTTs (x-axis) fit the
interpolated Sounder observations (y-axis) with reasonable skill,
especially
for low clouds with Brightness Temperatures (BTs) greater than
253K.
The CRAS had difficulty in producing thicker
low, and particularly high clouds.
Higher, thicker clouds are colder than their lower and thinner
counterparts (Petty, 2004). Thus, a
significant array of outliers existed below the diagonal signifying the
CRAS
initialized with warmer than observed clouds.


Figure 2. (Left) CRAS 20km 11um satellite image valid at initialization, 12Z (~7am). (Right) Actual GOES-12 image with Wade enhancement.
RMS errors emanated from initialization demonstrated the acceptable 00hr assimilation of Sounder data, with values of 9.2K respectively. Initialization RMS errors for comparisons against assimilated Sounder data were roughly 4K less than when compared to Imager data (Harrington, 2005). Lower RMS errors can be partially accounted for validation against GOES Sounder data that was actually assimilated in the CRAS.
In accordance to qualitative findings, the forecast (CRAS) CTT mean was approximately 4K warmer than observed. A warmer forecast was directly related to model construction of thin, warmer clouds. Thus, a positive bias resulted of nearly 3.5K. In addition, data points coagulated along the diagonal are associated with observations devoid of complementary CRAS forecasted CTTs, likely in response to the aforementioned ECA threshold. Consequently, observations indicated a cloud with an apparent BT, but the CRAS forecasted the corresponding grid cell to have an ECA value of less than twenty-five percent; thus, no BT was generated.

FCST: SFC CTTP FOR 000 HRS AFTER 12UTC 13 APR 2006
ANAL: SFC CTTP ANAL 12UTC 13 APR 22UTC 13 APR 2006
RMS ERROR = 9.1762
FCST MEAN = 272.7389
ANAL MEAN = 269.2182
BIAS = 3.5206
CORR COEF = 0.8910
S1 SCORE = 47.1555
**W** SETCON: NO DEFAULT FOR DIF
FIELD DIF; MAX = 0.567896E+02, MIN = -0.204534E+02
Figure 3. Scatter plot and subsequent statistical results for 00hr CRAS initialization of GOES Sounder data, valid 12Z April 13 2006 (~7am CDT).
Expectantly, RMS errors and biases would increase with each 03 hourly timestep. To avoid reiterative conclusions, the 06hr and 12hr hourly CRAS forecasts, valid 18Z 13 April (~1pm CDT) and 00Z 14 April (~7pm CDT) were validated and included.
b) 18Z 13 April – 06hr forecast:
By 18Z 13 April, surface temperatures in the seventies and eighties were realized across much of the central Midwest, as far north as Iowa and southern Minnesota, under relatively clear skies as seen by GOES-12 Imager (Fig. 3 bottom). Fig. 3 depicted the dominating ridge pattern over the Upper Midwest had shifted eastward to the western Great Lakes Region. CRAS 06hr 11um cloud forecast (Fig. 3. top) produced the spatial extent of the overall synoptic pattern, illuminated by the existence of high cirrus clouds over southwestern Lake Superior, south into Wisconsin and southwestern Lake Michigan, northeast of Chicago, Illinois. The model did not assume the magnitude of the cold CTTs however, with the validating GOES-12 11um image (Fig. 3 bottom) indicating the presence of colder CTTs (gray colors) as far southeast as Milwaukee, Wisconsin.

Figure 4. CRAS 06hr (top) 11um forecast, valid 18Z 13 April (~1pm CDT). GOES-12 (bottom) validating 11um satellite image with Wade enhancement, valid at the same time.
Furthermore, while the CRAS accurately forecasted the feature over the Wisconsin vicinity, it produced fictitious low clouds over much of North Dakota, as well as orographically induced structures, likely convection, over north-central Colorado and southeast Wyoming. The latter features are not entirely erroneous due to the presence of a dominating high-pressure system over the Central Plains Sates; leading to enhanced upslope motions through the addition of mean south-southeasterly flow to the diurnal thermal upslope circulation exhibited in the Eastern Rockies (Ray, 1986).

FCST: SFC CTTP FOR 006 HRS AFTER 12UTC 13 APR 2006
ANAL: SFC CTTP ANAL 12UTC 13 APR 22UTC 13 APR 2006
RMS ERROR = 11.2606
FCST MEAN = 278.0718
ANAL MEAN = 274.2283
BIAS = 3.8435
CORR COEF = 0.9100
S1 SCORE = 37.8564
**W** SETCON: NO DEFAULT FOR DIF
FIELD DIF; MAX = 0.764827E+02, MIN = -0.422270E+02
Figure 5. Scatter plot and subsequent statistical results of 06hr CRAS forecast against 18Z GOES Sounder data, valid 18Z April 13 2006 (~1pm CDT).
RMS errors generated (Fig. 5) for the CRAS 06hr forecast, valid 18Z (~1pm CDT), validated against GOES Sounder data at the same time, indicated an RMS error increase by approximately 2K. This was expected due to the non-perfective nature of numerical modeling. Again, in comparison to 2004-2005 statistics, RMS errors generated against Sounder versus Imager data were significantly lower (Harrington, 2005). Similar changes were noted in computation of CTT means and biases. A forecasted (CRAS) mean of 278K resulted in a positive model bias of roughly 4K, a 0.3K increase from initialization.
It appeared that the CRAS genuinely produced clouds near the freezing level, denoted by the closeness of data near the diagonal at 273K (Fig. 5). The concentration of data points in the lower-left portion of the scatter was related to high, though warmer, cloud structures built by the CRAS. The warm-bias clouds likely corresponded to the cold-cloud shield over the western Great Lakes Region; and, as mentioned before, justified with qualitative observations.
Although qualitative and quantitative assessments argued a less than perfect 06hr forecast, the CRAS maintained highly credible satellite results that accurately projected the overall synoptic pattern out to 18Z. The addition of another six hours would undoubtedly increase RMS errors and model biases. Nevertheless, the CRAS 12hr forecast, valid 00Z 14 April (~7pm CDT), captured the initiation and subsequent growth of convection that ensued tornado and large hail fabrication over Iowa and Wisconsin.
c) 00Z 14 April – 12hr forecast:

Quantitative findings validated the underestimation of CTTs, the mesoconvective complex over northern Minnesota, as well as the over-production of low clouds across the deformation zone across Iowa and northern Illinois. RMS errors (Fig. 7) increased to nearly 16K, which was more indicative of validating results of initialization against Imager data. Despite the assuring comparison to Imager data, the CTT mean and bias increased, with values of 272K and 7K respectively. Thus, while CRAS predicted a convergence zone conducive for strong thunderstorm growth over Iowa and northern Illinois, its production of warm, low-cloud structures, and inability to resolve colder CTTs, reduced pristine statistical results. However, the fact that the CRAS was able to predict the initialization zone for ensuing severe convection was an encouraging find.
FCST: SFC CTTP FOR 012 HRS AFTER 12UTC 13 APR 2006
ANAL: SFC CTTP ANAL 12UTC 13 APR 22UTC 13 APR 2006
RMS ERROR = 15.8636
FCST MEAN = 271.8497
ANAL MEAN = 264.7728
BIAS = 7.0769
CORR COEF = 0.8247
S1 SCORE = 44.6703
**W** SETCON: NO DEFAULT FOR DIF
FIELD DIF; MAX = 0.680432E+02, MIN = -0.440279E+02
Figure 7. Scatter plot and subsequent statistical results of 12hr CRAS forecast against 00Z GOES Sounder data, valid 00Z April 14 2006 (~7pm CDT).
Implementation
of research into a new, innovative meteorological tool, Integrated Data
Viewer
(IDV), commissioned a comprehensive three-dimensional understanding of
the 13
April 2006 event. With simple
keystrokes, CRAS vis5d files, i.e., visualization files, were loaded
into IDV
and used to plot cloud liquid water content (CCL), measured in [g/kg],
and rain
rate (CRN), measured in units of [g/kg].
Note, CCL and CRN isosurfaces were defined as mixing ratios,
with higher
CRN values leading to larger hydrometeors; and subsequently, heavier
precipitation. Fig. 8 illustrated a
3-D
perspective of the ridging pattern and subsequent precipitation over
the Upper Midwest, valid 21Z 13 April
(~4pm CDT).
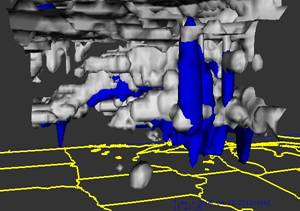
Significant was the thicker clouds associated with the cloud shield stretching from Lake Superior, southeast to southwest Lake Michigan. Also important was a single cloud formation over central Iowa, east of Fort Dodge. This formation signaled the apex of a convergence zone associated with a short-wave disturbance over southern Minnesota, extending east-southeast to Chicago, Illinois.

Figure 9. Integrated Data Viewer (IDV), 3-D perspective of CRAS generated cloud liquid water content (gray), and precipitation (blue), valid 01Z 14 April (~8pm CDT); the time of the Iowa City, tornado.
IV. Conclusions
The CRAS still struggled with convection; and, most numerical models will, due to the current state of technology, available manpower, and funds. Nonetheless, the CRAS accomplished the correct placement of convective initialization by 21Z 13 April over central Iowa, despite the presence of overwhelming low-clouds and consequent lack of solar irradiance over the general vicinity. It evolved a singlet cloud to severe limits over southeastern Iowa. In reality, the model evolution was perfect; as an F-2 tornado devastated Iowa City, Iowa at the same time the CRAS positioned the storm over the area. This was not to imply that the CRAS could model individual tornadoes, let alone supercellular thunderstorms; rather, the CRAS pragmatically fashioned an area where moisture and heat fluxes were maximized in an environment favorable for supercellular growth. This was not surprising since the CRAS had achieved similar results with its moisture physics in other cases (Aune, 2006). The CRAS was not used for individual tornado forecasting; yet, it was useful in discerning areas where convective initialization would be primed. Thus, the CRAS may be a useful analysis tool for NASA functions that are deterred by convective activity.
In the future, the CRAS need experiment with building thicker clouds, with subsequent colder CTTs. A new cloud physics scheme, devised by Kong and Yau (1998) will enable the CRAS to explicitly formulate ice-clouds. Thus, better ice-clouds would result in better CTT forecasting of high, cold cloud structures, like cirrus clouds. Additionally, should the CRAS produce better ice-clouds, then perhaps the 2005-2006 exhibited warm bias would be partially negated.