GOES-R Proving Ground: Webpage Contribution by CIRA
CIRA’s Plans
for FY08:
• Establishment of the Proving Ground at CIRA
– Staffing and equipment to ensure robust
production
– Work began on moving RAMSDIS products into
AWIPS and creating menu lists with assistance from CIMSS and NOAA/ESRL
– NexSat imagery ingest to require a novel approach
• Develop initial set of ABI prototype products
– Selected RAMSDIS On-Line products
– NexSat products where applicable
– CIMSS/SPoRT products where applicable
– Training materials for all demonstration
products
• Foster interactions with neighboring offices
– Initial contact and site visits to Boulder,
Cheyenne, and Miami offices have been established
– Establish protocols for product ingest &
usage
– Include additional NWS forecast offices (Monterey)
Initial Suite of
Proving Ground Products produced by CIRA:
1.
Shortwave Albedo
Product
Day/night technique with low cloud/fog in
light gray to white. High clouds are color-enhanced based on
cloud-top temperature. Product is
computed from GOES shortwave and longwave spectral bands, to retrieve the
reflected component in the shortwave by subtracting the spectrally-equivalent
emitted component using the longwave band. Water-drop/fog/stratus show up because of their high
reflectance/albedo in the shortwave.
2.
Natural color imagery
‘Natural’ or ‘True’
color satellite imagery is preferred by analysts over panchromatic visible because
it is visually intuitive, less ambiguous, and has higher information content
(feature recognition). It is being produced by synthesizing the missing green
band.
Truth Approximation
Relative Difference (%)
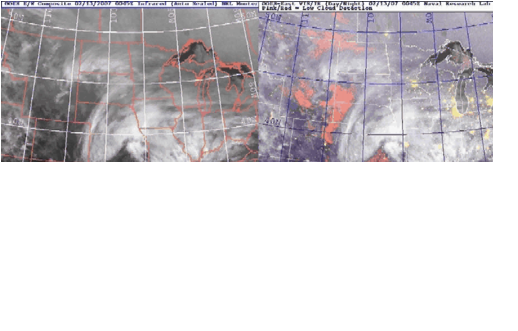
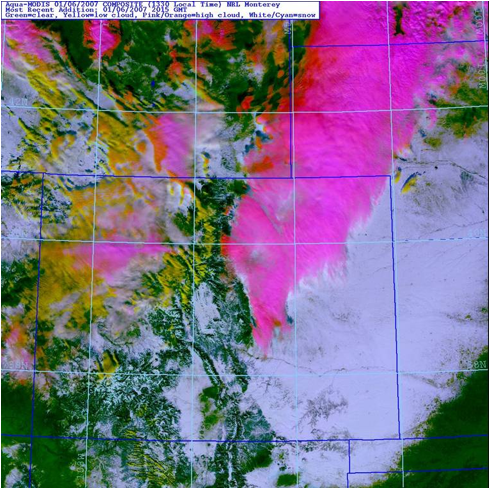
3.
“GeoColor” multi-layer blending
The GeoColor technique was originally designed to illustrate the concept
of natural color imagery from geostationary orbit (e.g., GOES-R ABI +
NPOESS-VIIRS). The
technique blends VIS/IR satellite imagery with MODIS
blue marble and OLS backgrounds.
It soon became apparent that this dynamic blending approach held far more
potential for multi-parameter visualization. This dynamic blending approach allows
consolidating multiple enhancement techniques into a single value-added image.
Standard Infrared
GeoColor” (Pink=low cloud)
4.
Snow/cloud discrimination
High spatial resolution snow cover imagery is improved via cirrus
filtering using the 1.38 mm band
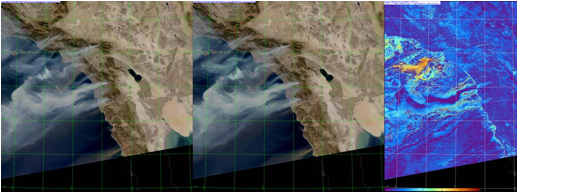
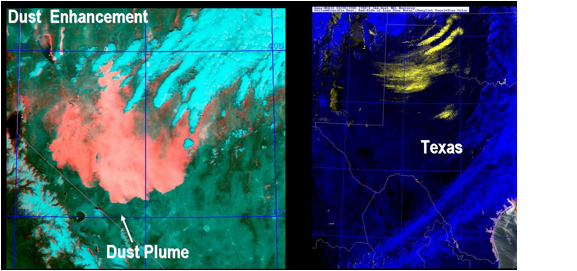
5.
Advanced dust / ash detection:
Blue Light Absorption Technique for
Mineral Dust Enhancement
A “normalized
difference dust index” (NDDI) is defined as the difference between the
reflectance of the red and blue channel normalized by the sum of the
reflectance
NDDI = (R853 – R469) / (R853 + R469)
The “Blue Light
Absorption Technique for Mineral Dust Enhancement” techniques uses
the NDDI in place of the red channel of a
natural color composite to enhance the dusty portion of the scene in pink/red
tonality for rapid identification by analysts.
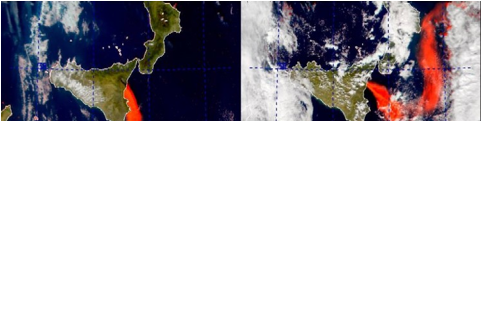
The “Blue Light
Absorption Technique” has also been used successfully for volcanic ash
enhancement. The figure below depicts the enhancement of the volcanic ash of
Etna volcano, Italy, 2002.
30 October 2002 1110 Z
7 November 2002 1143 Z
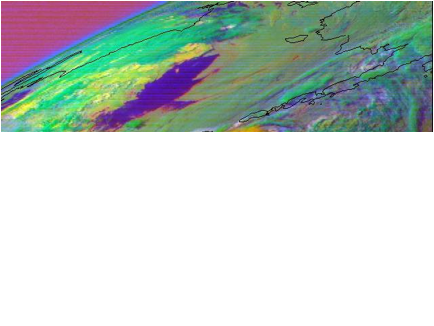
6.
Advanced ash detection: Principal Component Image (PCI)
Analysis
PCIs extract dominant image combinations from the available GOES bands.
In the figure below the PCI technique has been used to
conduct an analysis of the initial
Okmok volcano eruption from 12/13 July 2008.
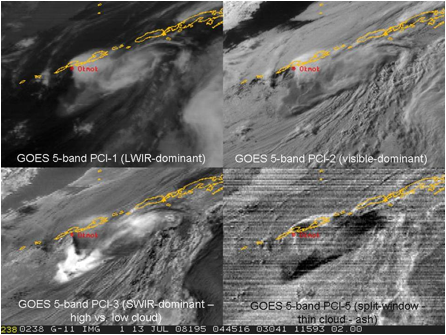
PCIs can also be combined using RGB (3-color) analysis (see image below). The colors chosen to enhance the ash cloud, with PCI-2, 3, and 5 as Red, Green, and Blue, respectively. Clear areas in the image are deep purple, high clouds are mainly green, lower clouds are yellow, and heavily-ash-dominated cloud is orange. Note the higher concentration of ash in the plume south of the volcano vs. the plume east of the volcano.