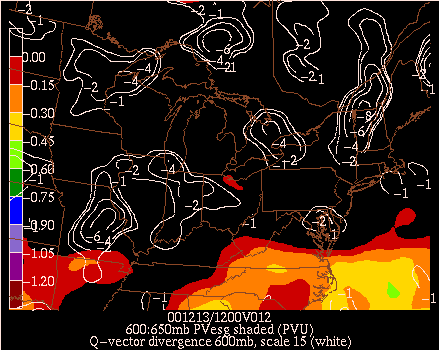
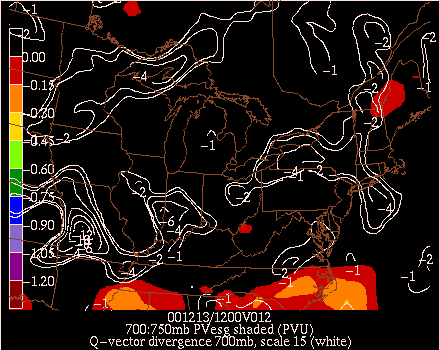
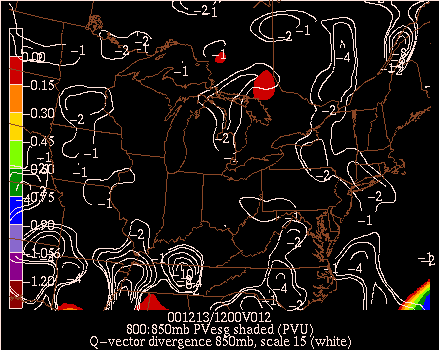
Forcing Diagnostics
This page shows a comparison of forcing for vertical motion diagnostics at 4 locations over the central U.S. on 13 December 2000. These forcing diagnotics products are available over the Central and Eastern regions of the U.S. on the Interactive NWP Diagnostic Tool page, derived from either the 90-km NCEP Eta 104 or the 24-km Canadian GEM model.
The 4 blue "+" symbols denote the locations of the vertical profiles of forcing shown below (near Springfield MO KSGF, Topeka KS KTOP, Indianapolis IN KIND, and Madison WI KMSN).
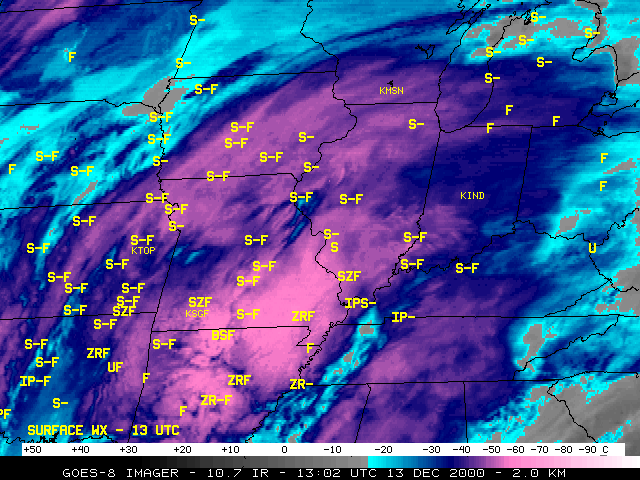
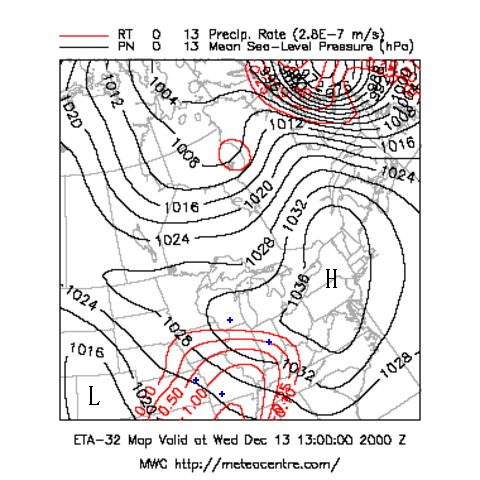
The GOES 10.7 micrometer IR image with surface weather reports shows moderate snow at KSGF, and light snow at KTOP. Cold cloud tops are beginning to overspread KIND and KMSN, but no precipitation was yet being reported north and northeast of the developing system over the southern Plains.
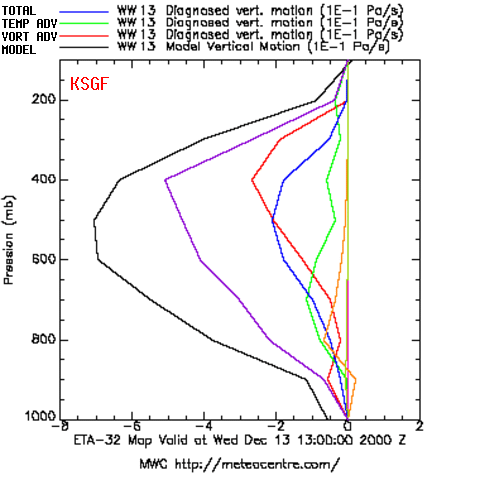
Over the Springfield MO KSGF region, total diagnosed forcing for vertical ascent (violet) was increasing with height up to around 400 mb, due mainly to contributions from positive vorticity advection (red) and latent heat release (blue) which were also increasing with height. Below the 600 mb level, temperature advection (green) was also making an important contribution to forcing for ascent.

Over the Topeka KS KTOP region, total diagnosed forcing for vertical ascent (violet) was strongest around 400 mb, with a secondary maximum around the 800 mb level. In the upper troposphere (600-400 mb), the dominant forcing for ascent was positive vorticity advection (red), but this was offset somewhat by negative contributions from temperature advection (green) and latent heat release (blue). Lower in the troposphere (700-900 mb), positive vorticity advection (red) was still the dominant component of forcing for ascent, with an additional component due to friction (orange).
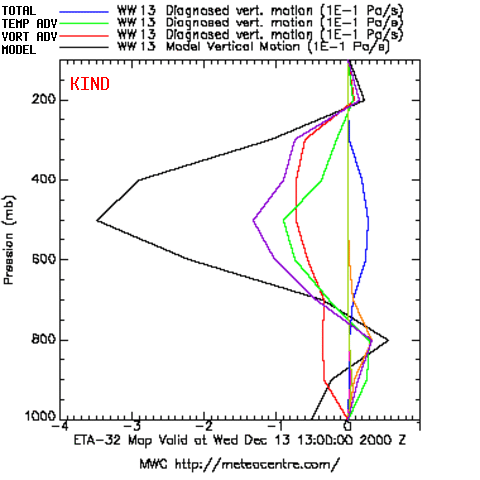
Over the Indianapolis IN KIND region, total diagnosed forcing for ascent (violet) was only present within the middle to upper troposphere (300-700 mb), due to contributions from positive vorticity advection (red) and temperature advection (green). Below this layer of forcing for ascent, negative contributions from other types of forcing offset the small amount of forcing through positive vorticity advection (red) that was present.
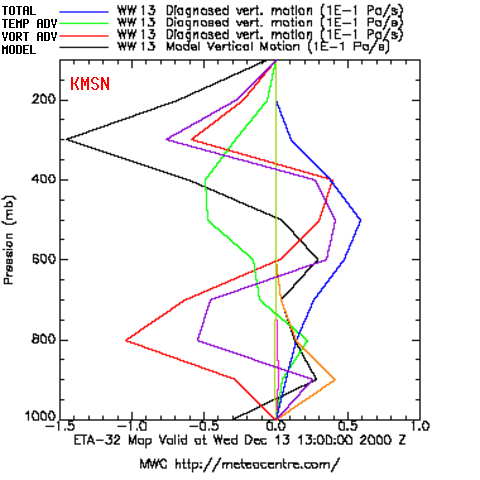
Over the Madison WI KMSN region, total diagnosed forcing for ascent (violet) was present in the 700-800 mb layer, and higher aloft in the 200-300 mb layer, due mainly to positive vorticity advection (red). Within the middle troposphere, forcing for ascent was negative, even though there was a significant contribution from temperature advection (green)...negative contributions from latent heat release (blue) and vorticity advection (red) were enough to offset the positive temperature advection term.