Timothy J. Schmit
Gary S. Wade
Robert M. Aune
Advanced Satellite Products Team
Anthony J. Schreiner
Cooperative Institute for Meteorological Satellite Studies
Madison, WI 53706
Abstract. This paper includes a brief overview of the new generation of GOES sounders and a description of several of the automated, quantitative products derived from the GOES-8/9 sounder data. Products include temperature and moisture profile retrievals at clear fields-of-view, and cloud heights and amounts for all cloudy fields-of-view. This paper summarizes the quality of the sounder products, discusses early use by the National Weather Service, and provides some locations for accessing sounder data.
1. Introduction
As the need for meteorological observations at finer spatial resolution and higher temporal frequency increases, the remotely sensed measurements from the new generation of GOES sounders are being investigated to fill the void. Products from the sounders are produced every hour over North America and nearby oceans. The suite of products includes atmospheric temperature and moisture profiles and derived images of meteorological parameters such as total water vapor and cloud top pressures. Derived images which display a meteorological parameter, such as precipitable water, are shown with a color coded mapping for each field-of-view (fov) (Hayden et al., 1996).
Clear column brightness temperatures, gradient winds, water vapor winds (Velden et al., 1997), atmospheric stability, skin temperatures and Outgoing Longwave Radiation (OLR) are other sounder products which will not be discussed in this paper.
2. The Sounders
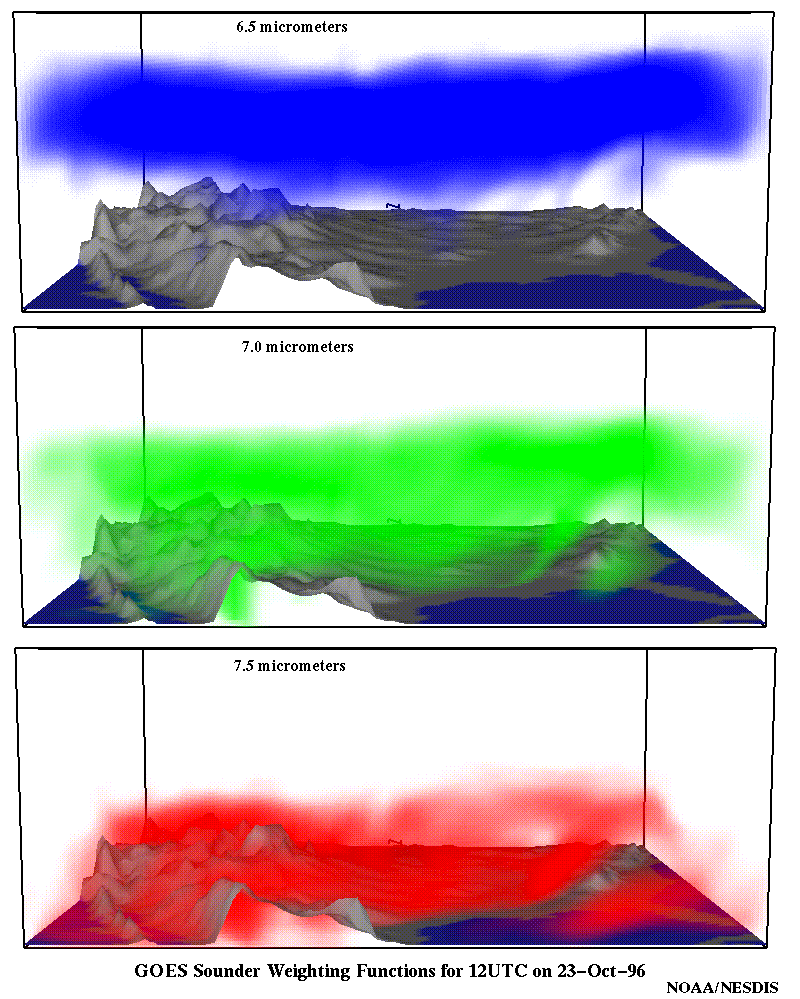
The GOES-8/9 sounders are 19 channel filter wheel radiometers that measure radiation in 18 infrared bands, as well as one visible band (Menzel and Purdom, 1994). The fovs are sampled at a nominal spacing of 10 km. The spectral coverage ranges from 3.7 to 14.7 micrometers (Figure 1). Each sounder channel senses radiation from different layers of the atmosphere. The weighting functions calculated from the standard atmosphere for longwave (Figure 2a), midwave (Figure 2b), and shortwave (Figure 2c) channels provide a graphical representation of these layers. The weighting functions can also be displayed in three dimensions, using model temperature and moisture fields. Channels 10 (Figure 3a), 11 (Figure 3b) and 12 (Figure 3c) are shown from October 23, 1996; all three sounder water vapor channels (10-12) are also shown (Figure 3). The varying heights can be clearly seen for the three channels.
Both spatial resolution and signal to noise are improved on the GOES-8/9 sounders over that of the GOES-7 VISSR Atmospheric Sounder (VAS) instrument (Table 1). For the midwave bands, radiance measurements also demonstrate improvement over the current polar-orbiting High resolution Infrared Radiation Sounder (HIRS) instrument. An example of the hourly GOES-8/9 sounder coverage of North America and nearby oceans for the 7.0 micrometer channel from March 18, 1997 is shown (Figure 4).
3. Retrievals of moisture and cloud top pressures
The GOES-8/9 sounding products are generated each hour. The processing involves several steps (Figure 5): a) determine which fovs are clear or cloudy by comparing channels and comparing the window channel to surface observations (Hayden, et al., 1997); b) perform radiative transfer calculations with the NCEP numerical model forecast (6 to 18 hour) used as a first guess and surface observations used as boundary conditions; c) average radiances for the clear sky fovs within a 5 x 5 fov sounding area (approximately 50 km spacing) and apply a radiance bias adjustment; d) perform a simultaneous physical retrieval of temperature and moisture profiles (Figure 6) (Smith, 1983; Hayden, 1988; Ma et al., 1997); e) determine cloud top properties for all cloudy fovs (Schreiner, 1993; Schreiner et al., 1995). An example of the sounder retrieval coverage for March 18, 1997 is shown (Figure 7).
The CO2 absorption technique is used to derive cloud amount, height, and temperature. The algorithm uses the longwave channels of the sounder which see progressively deeper into the atmosphere, such that certain channels "see" cloud tops while channels that peak higher do not (Figure 8). A site-specific cloud product is used to complement the ASOS (Automated Surface Observing System) which does not detect clouds higher than 12,000 feet (~650 hPa). A composite report, developed from cloud information for each of the 5 x 5 fov near a surface site, gives cloud height and amount, (i.e., high, scattered clouds). A derived cloud image is processed for all cloudy fovs. An example of the sounder cloud product image is shown from March 19, 1997 (Figure 9) with varying colors used to denote cloud top pressures (low clouds are colored orange and the highest clouds are blue or white) (Schreiner et al., 1995).
4. Product quality
There are several ways to determine the amount of information the sounders are providing beyond that already available from other sources. One method is to compare the retrieved profiles and the numerical model profiles to co-located radiosondes. This is not an ideal comparison due to differing measurement characteristics (point versus volumetric), co-location errors (matches are restricted to 0.25 degrees), time differences (within one hour) and radiosonde errors (Schmit, 1996). Nevertheless, during the period from April 1996 through February 1997, a large improvement in moisture detection is evident when comparing sounder retrievals to model first guess (Table 2). The improvement for RMSE of the total water vapor is roughly 20% (3.3 to 2.6 mm). These results are based on a version of the retrieval algorithm that was implemented operationally by NOAA/NESDIS on February 7, 1997.
Numerical model assimilation provides another method to assess the quality of the sounder products. The sounder layered moisture data has improved numerical model forecasts. During the spring of 1996, NCEP ran a parallel test incorporating GOES-8/9 data into the Eta model analysis. The operational model was the control run. The experimental run was the operational model plus moisture information (total water vapor as well as three layers of moisture) inserted every three hours from the GOES-8/9 sounders. As in an earlier impact test (Lin et al., 1996), this data was assimilated using an Optimum Interpolation analysis. Validation with respect to raingauges and radiosondes revealed that the forecasts were generally improved by using the GOES data. Overall improvements are seen in the equitable threat scores (Schaefer, 1990) for 24-hour accumulated precipitation (Figure 10a), with consistent improvements (closer to 1) in the equitable threat score biases (Figure 10b). This improvement is more evident in the reduction of the number of grid boxes predicting precipitation but not verifying (false alarms) (Figure 11). A reduction of 40 false alarm grid boxes (80 km resolution) equates to an areal improvement in the experimental forecast of 256,000 km2. Positive impact is also noticeable in radiosonde comparisons of relative humidity both at 12 hours (Figure 12a) and 24 hours (Figure 12b). As a result of these findings, NCEP has placed a high priority on using the GOES sounder moisture data operationally.
Tests have verified the quality of the satellite derived cloud product. In these tests, the ASOS only cloud determination and the ASOS plus the satellite observation were compared to ground observations. Results show a decrease in error from 17% (ASOS only) to 6% (satellite data plus ASOS) compared to ground observations (Schreiner, 1993).
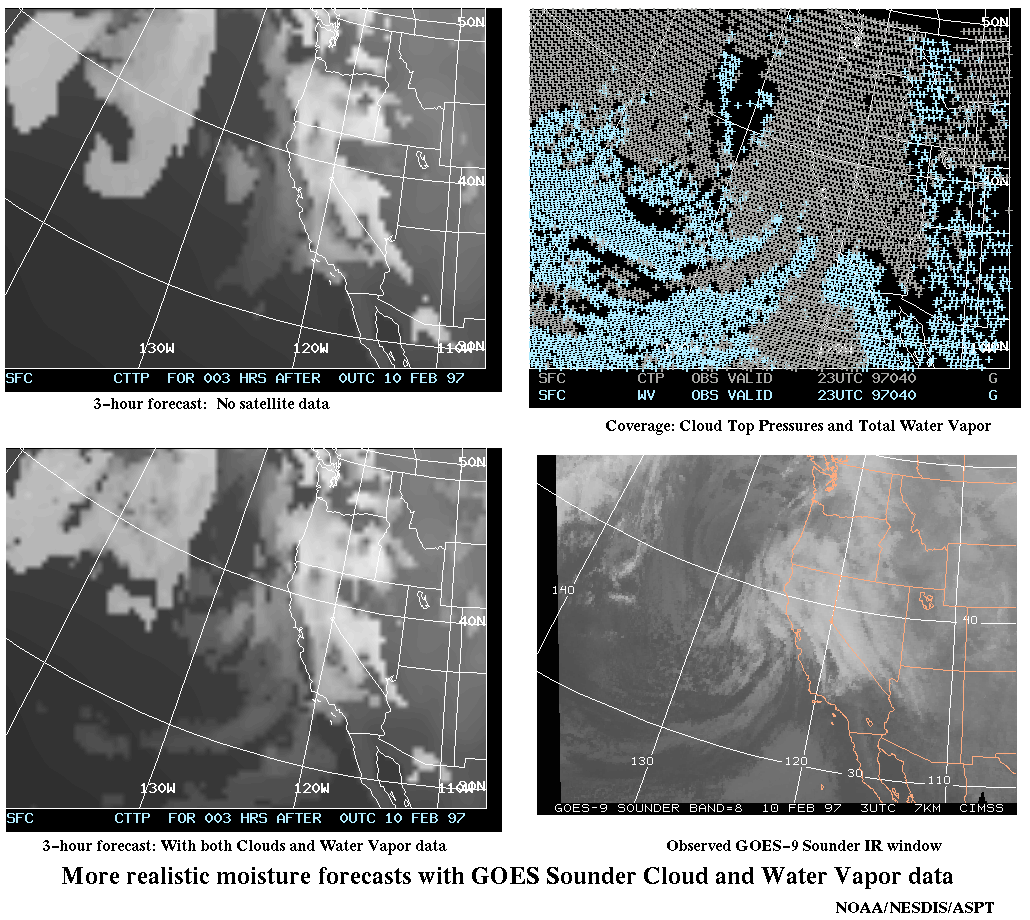
In addition to supplementing the ASOS, cloud information has also been used as input to numerical models. Currently, total water vapor and cloud top information are being used in the CIMSS Regional Analysis System (CRAS). A case from February 10, 1997 demonstrates the impact of using both cloud and moisture datasets. Cloud information and moisture retrievals in clear sky provide sounder input over the complete domain (Figure 13a). The CRAS model does not resolve the moisture front and low clouds off the California coast without the satellite data (Figure 13b), but does after using the GOES sounder satellite data (Figure 13c). Agreement with the GOES-9 sounder image is seen (Figure 13d). A four panel image is also available (Figure 13).
The largest impact of the satellite data is often in regions void of conventional observations. Using the Eta model initial conditions determined with and without the GOES-8 sounder data, total water vapor differences are shown from February 18, 1997 (Figure 14a). One area in the western Gulf of Mexico shows an 11 mm difference (18 mm in the model and 29 mm observed by the satellite). This return moisture event over the Gulf of Mexico is verified by the SSM/I total water vapor (Figure 14b).
Sounder products have been used directly by some forecasters, even though the distribution of these products has been limited. Comparison of hourly sounder derived moisture patterns to those from a forecast is often informative about rapidly changing weather situations. The atmospheric instability determined from the retrieved profiles can help pinpoint a region of possible severe weather. The cloud top pressures have been used as a forecast aid for aviation forecasters and pilots.
5. Summary
Some of these sounder derived products are available from the National Climate Data Center (NCDC) at http://www.ncdc.noaa.gov. As an example, the site-specific cloud product can be found in a text format or the retrieved profiles can be obtained in a BUFR format. Real-time examples of both retrieved moisture information and cloud top pressures can be seen on the CIMSS web page at http://cimss.ssec.wisc.edu. Another site with real-time GOES sounder products is http://orbit7i.nesdis.noaa.gov:8080/goes.html supported by the NOAA/NESDIS Forecast Products Development Team.
The GOES sounder data and products are produced on a higher space and time scale than conventional observations. The overall quality of the GOES sounder measurements and the added information from the products have been verified by comparison to independent observations. Products from the GOES-8/9 sounders are being used operationally by the National Weather Service and by the research community. The cloud top information is complementing ASOS and has been used to initialize numerical models. The sounder moisture data, such as total precipitable water and layers of moisture, will soon be used operationally in the Eta model.
6. References
Hayden, C. M., 1988: GOES VAS simultaneous temperature moisture retrieval algorithm, J. Appl. Meteor., 27, 705-733.
Hayden, C. M., G. S. Wade and T. J. Schmit, 1996: Derived product imagery from GOES-8. J. Appl. Meteor., 35, 153-162.
Hayden, C. M., T. J. Schmit, and A. J. Schreiner, 1997: The Cloud Clearing for GOES Product Processing. Submitted as a NOAA/NESDIS Technical Report.
Lin Y., E. Rogers, G. J. DiMego, K. E. Mitchell and R. M. Aune, 1996: Assimilation of GOES-8 Moisture Data into NMC's Eta Model. Eighth Conference on Satellite Meteorology and Oceanography. 518-520.
Ma, X., W. L. Smith and T. J. Schmit, 1997: A Non-Linear Physical Retrieval Algorithm - Its Application to the GOES-8/9 Sounder. Submitted to J. Appl. Meteor.
Menzel, W. P. and J. F. W. Purdom, 1994: Introducing GOES-I: The first of a new generation of geostationary operation environmental satellites. Bull. Amer. Meteor. Soc., 75, 757-781.
Schaefer, J. T., 1990: The critical success index as an indicator of warning skill. Wea. Forecasting, 5, 570-575.
Schmit, T. J., 1996: Sounder bias correction of the east-west gradient. Society of Photo-Optical Instrumentation Engineers Conference. GOES-8 and Beyond. August 4-9, 1996. Denver CO.
Schreiner, A. J., D. Unger, W.P. Menzel, G. Ellrod, K. Strabala and J. Pellet, 1993: A comparison of ground and satellite observations of cloud cover. Bull. Amer. Meteor. Soc., 74, 1851-1861.
Schreiner, A. J., T. J. Schmit, C. M. Hayden, and W. P. Menzel, 1995: Images of satellite-derived cloud top pressure for the contiguous United States. NWA Conference, 3-8 December 1995. Houston, TX. 35pp.
Smith, W. L., 1983: The Retrieval of Atmospheric Profiles from VAS Geostationary Radiance Observations. Journ. Atmos. Sciences., 40, 2025-2035.
Velden, C. S., C. M. Hayden, S. J. Nieman, W. P. Menzel, S. Wanzong and J. S. Goerss, 1997: Upper-Tropospheric Winds Derived from Geostationary Satellite Water Vapor Observations. Bull. Amer. Meteor. Soc., 78, 173-195.
7. List of Figures
1. The regions of the spectrum that are measured by the GOES sounders, from 3.7 to 14.7 micrometers, are compared to an Earth emitted spectra.
2a. The GOES sounder longwave channel weighting functions calculated from the standard atmosphere. A weighting function depicts the layer of the atmosphere where the radiation originated.
2b. The GOES sounder midwave channel weighting functions calculated from the standard atmosphere. A weighting function depicts the layer of the atmosphere where the radiation originated.
2c. The GOES sounder shortwave channel weighting functions calculated from the standard atmosphere. A weighting function depicts the layer of the atmosphere where the radiation originated.
3a. Band 10 weighting functions for the GOES sounder water vapor channel in three dimensions for October 23, 1996 at 12 UTC.
3b. Band 11 weighting functions for the GOES sounder water vapor channel in three dimensions for October 23, 1996 at 12 UTC.
3c. Band 12 weighting functions for the GOES sounder water vapor channel in three dimensions for October 23, 1996 at 12 UTC.
3. Weighting functions for the GOES sounder water vapor channels in three dimensions for October 23, 1996 at 12 UTC.
4. An example of the hourly sounder coverage of North America and nearby oceans for the 7.0 micrometer channel from both GOES-8 and -9 on March 18, 1997. The data have been remapped into a Lambert Conformal projection.
5. A flow chart of the GOES sounder processing system which shows that temperature and moisture retrievals are generated in the clear regions, and cloud information is determined for all cloudy fovs.
6. A flow chart is shown that depicts the steps for retrieval generation. After the satellite data has been filtered for clouds, averaged, and bias corrected, temperature and moisture retrievals are generated via a simultaneous physical retrieval algorithm. The algorithm is an iterative approach were the temperature and moisture profiles and skin temperature are modified so the retrieved profiles more closely match the observed values.
7. The GOES-8/9 sounder retrieval coverage (white boxes) are plotted over the infrared window image for March 18, 1997 at 18 UTC. Each white square represents a retrieved profile over a 5 x 5 fov sounding area (approximately 50 km spacing).
8. The four channels of the sounder that are used to calculate the cloud information. Shown are bands 3, 4, 5 and 8 (infrared window) for March 18, 1997 at 18 UTC. Note how each channel senses progressively lower in the atmosphere.
9. The combined GOES-8/9 sounder cloud product image from March 18, 1997 at 18 UTC. The colors denote the cloud top pressure, low clouds are colored orange and the highest clouds are blue or white.
10a. The Eta model forecasts using the GOES sounder moisture data showed improvements (positive difference) in the equitable threat score for 24-hour precipitation.
10b. The Eta model forecasts using the GOES sounder moisture data showed significant decreases (closer to 1) in the equitable threat score biases for 24-hour precipitation.
11. The Eta model forecasts using the GOES sounder moisture data showed decreases in the false alarm differences for 24-hour precipitation.
12a. Significant positive impact is shown with radiosonde comparisons of relative humidity at 12 hours.
12b. Positive impact is shown with radiosonde comparisons of relative humidity at 24 hours.
13a. The coverage of the sounder data, both the retrieved water vapor and cloud heights.
13b. The simulated infrared window from the CRAS model without the satellite data.
13c. The simulated infrared window from the CRAS model with the satellite data.
13d. The 03 UTC infrared image from the GOES-9 sounder.
13. A four panel image which shows the model resolving the moisture front and low clouds off the California coast with the GOES-9 satellite data for February 10, 1997.
14a. The difference (in mm) of the Eta model with and without the GOES sounder total water vapor for February 18, 1997. Note the dramatic difference in the Western Gulf of Mexico.
14b. The SSM/I total water vapor image from February 18, 1997 shows the moisture return along the Western Gulf.