Scene from 0000-0100 UTC on 29 April 2017
![GOES-16 ABI IR Window and GLM Imagery[Click to play animated GIF]](NSCGLM1/0000_0100_29apr2017anim.gif) **Click to play** This animation covers the time from 0000 to 0100 UTC on 29 April 2017. Earlier convection has moved off to the east of Missouri.(Click here for a slower animation)
**Click to play** This animation covers the time from 0000 to 0100 UTC on 29 April 2017. Earlier convection has moved off to the east of Missouri.(Click here for a slower animation)
Scene from 0059-0210 UTC on 29 April 2017
![GOES-16 ABI IR Window and GLM [click to play animated GIF]](NSCGLM1/0059_0210_29apr2017anim.gif) **Click to play**This animation covers the time from 0059 to 0210 UTC. Lightning is starting up again over the Bootheel of Missouri.
**Click to play**This animation covers the time from 0059 to 0210 UTC. Lightning is starting up again over the Bootheel of Missouri.
Scene from 0200-0252 UTC on 29 April 2017
![GOES-16 ABI IR Window and GLM [click to play animated gif]](NSCGLM1/0200_0252_29apr17anim.gif) **Click to play** This animation covers the time from 0200-0252 UTC on 29 April 2017. Lightning spreads across southern Missouri.(Click here for a slower animation)
**Click to play** This animation covers the time from 0200-0252 UTC on 29 April 2017. Lightning spreads across southern Missouri.(Click here for a slower animation)
Scene from 0250-0510 UTC on 29 April 2017
![GOES-16 ABI IR Window and GLM [click to play animated gif]](NSCGLM1/0250_0510_29apr17anim.gif) **Click to play**Lightning -- extensive Lightning -- persists in a line across southern Missouri (Click here for a slower animation).
**Click to play**Lightning -- extensive Lightning -- persists in a line across southern Missouri (Click here for a slower animation).
Scene from 0510-0710 UTC on 29 April 2017
![GOES-16 ABI IR Window and GLM [click to play animated gif]](NSCGLM1/0510_0710_29apr17anim.gif) **Click to play**Lightning expands into the cold cloud shield north of the main line of convection. (Click here for a slower animation).
**Click to play**Lightning expands into the cold cloud shield north of the main line of convection. (Click here for a slower animation).
Scene from 0700-0840 UTC on 29 April 2017
![GOES-16 ABI IR Window and GLM [click to play animated gif]](NSCGLM1/0700_0840_29apr17anim.gif) **Click to play**Lightning in the Cold Cloud Shield wanes. (Click here for a slower animation).
**Click to play**Lightning in the Cold Cloud Shield wanes. (Click here for a slower animation).
Scene from 0840-1200 UTC on 29 April 2017
![GOES-16 ABI IR Window and GLM [click to play animated gif]](NSCGLM1/0840_1200_29apr2017anim.gif) **Click to play**Lightning moves north into central Missouri as the southern Convective line weakens. (Click here for a slower animation).
**Click to play**Lightning moves north into central Missouri as the southern Convective line weakens. (Click here for a slower animation).
Scene from 1200-1550 UTC on 29 April 2017
![GOES-16 ABI IR Window and GLM [click to play animated gif]](NSCGLM1/1200_1550_29apr17anim.gif) **Click to play**Lightning is mostly over central Missouri. (Click here for a slower animation).
**Click to play**Lightning is mostly over central Missouri. (Click here for a slower animation).
Scene from 1550-1900 UTC on 29 April 2017
![GOES-16 ABI IR Window and GLM [click to play animated gif]](NSCGLM1/1550_1900_29apr17anim.gif) **Click to play**Lightning increases in central Missouri and moves to the south. (Click here for a slower animation).
**Click to play**Lightning increases in central Missouri and moves to the south. (Click here for a slower animation).
Scene from 1900-2200 UTC on 29 April 2017
![GOES-16 ABI IR Window and GLM [click to play animated gif]](NSCGLM1/1900_2200_29apr17anim.gif) **Click to play**Lightning gradually tapers off. (Click here for a slower animation).
**Click to play**Lightning gradually tapers off. (Click here for a slower animation).
Scene from 2200-0240 UTC on 30 April 2017
![GOES-16 ABI IR Window and GLM [click to play animated gif]](NSCGLM1/2200_0340_29_30apr17anim.gif) **Click to play**Lightning gradually tapers off (Click here for a slower animation).
**Click to play**Lightning gradually tapers off (Click here for a slower animation).
Animations of lightning -- These both cover only 10 seconds! But look how much electrical activity is captured -- and look at how much moreareal extent is there in GLM vs. the ENTLN!!
- This is an animation of cloud-to-ground lightning from a land-based sensor.
- This is an animation of cloud-to-ground lightning near St Louis from a land-based sensor.
- This is an animation of the GLM lightning pixels -- they change color as they age (black when new, then red/orange/yellow as time progresses).
- This is an animation of GLM with cloud-to-ground lightning from a land-based sensor for 10 seconds, near St Louis, starting at 0041 UTC.
- Here is that same scene played at two different speeds
- Fast Animation, ten seconds (004115-004125)
![GOES-16 GLM and ENTL data [click to play animated gif]](NSCGLM1/20170430004115.000.png)
- Slow Animatio, ten seconds (004115-004125)
- This is an animation of GLM with cloud-to-ground lightning from a land-based sensor for 10 seconds, near St Louis, starting at 0101 UTC.
- Here is that same scene played at two different speeds
- Fast Animation, ten seconds (004115-004125)
![GOES-16 GLM and ENTL data [click to play animated gif]](NSCGLM1/20170430010120.000.png)
- Slow Animation, ten seconds (004115-004125)
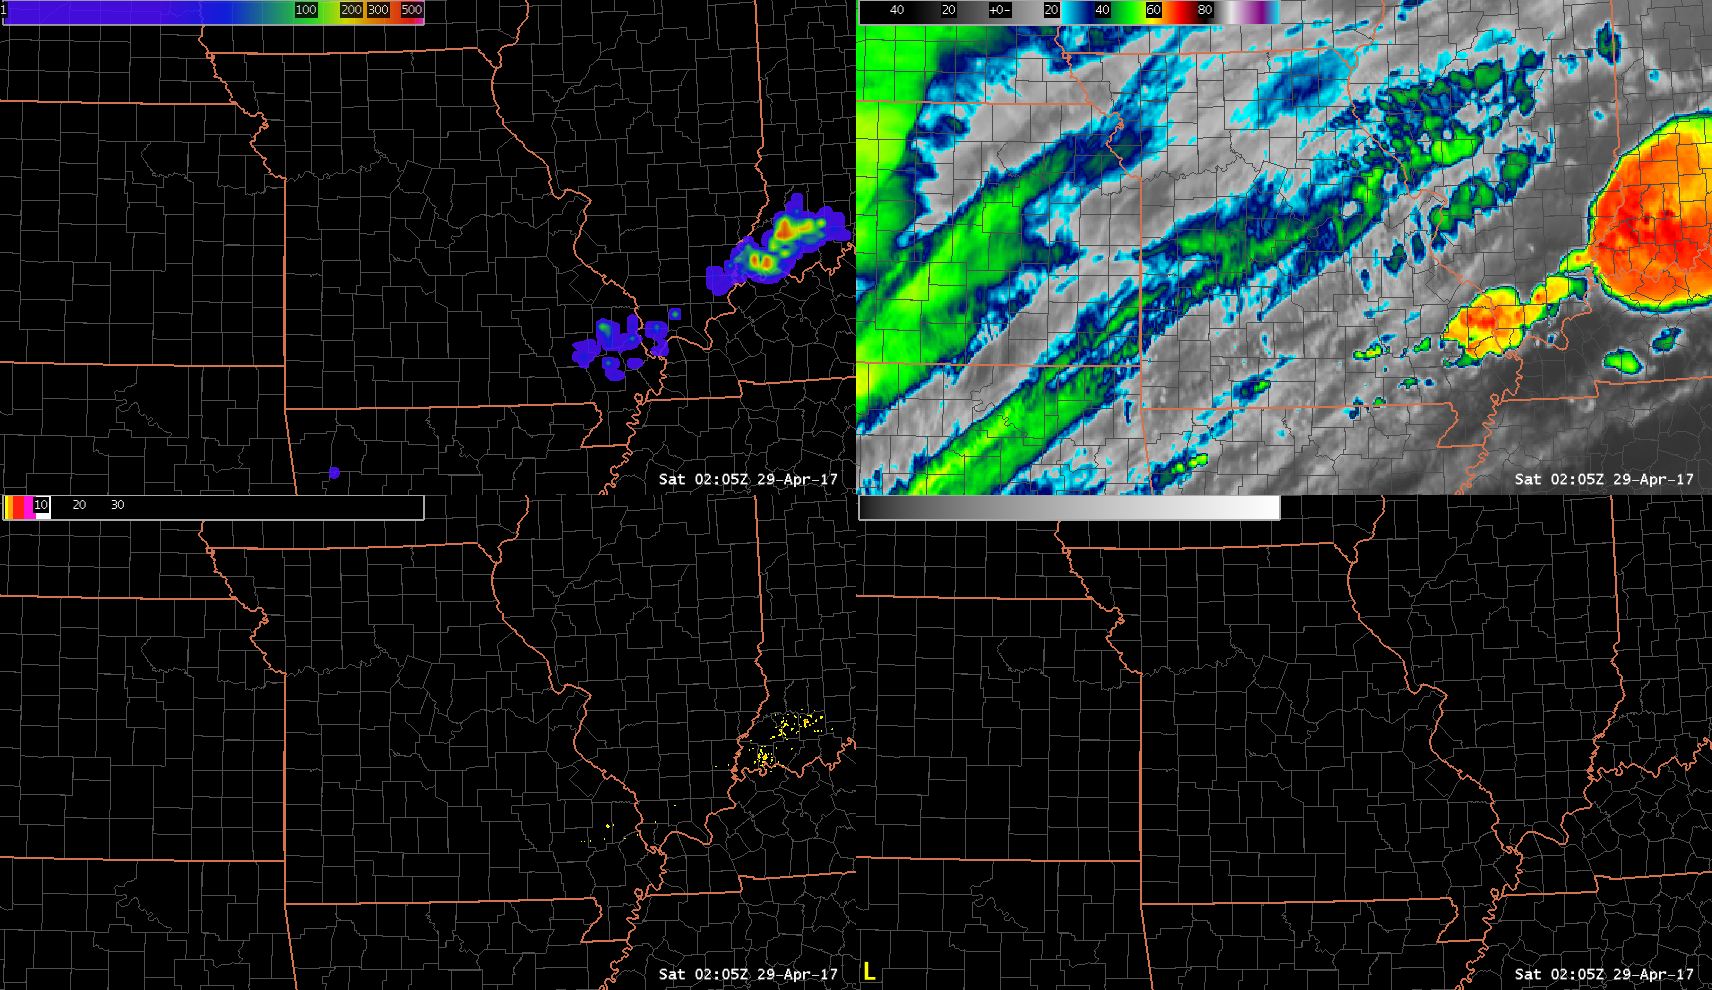
- This is an animation of GLM with cloud-to-ground lightning from a land-based sensor. This is a series of images that are in the animations above. But maybe those animatios are too fast for you to view. Note how the cooling of the cloudtops is preceding the GLM observations. For lightning to occur, there must be sufficient glaciation to allow for charge separation.
- 0100 UTC 29 April 2017
- 0105 UTC 29 April 2017
- 0110 UTC 29 April 2017
- 0115 UTC 29 April 2017
- 0120 UTC 29 April 2017
- 0125 UTC 29 April 2017
- 0130 UTC 29 April 2017
- 0135 UTC 29 April 2017
- 0200 UTC 29 April 2017
- 0205 UTC 29 April 2017
- 0210 UTC 29 April 2017
- 0215 UTC 29 April 2017
- 0220 UTC 29 April 2017
- 0225 UTC 29 April 2017
- Slow Animation, ten seconds (004115-004125)
- Slow Animatio, ten seconds (004115-004125)
- Fast Animation, ten seconds (004115-004125)
![GOES-16 GLM and ENTL data [click to play animated gif]](NSCGLM1/GLM_withCG_start20170430004115.000_end_20170430004125.000fastanim.gif)
![GOES-16 GLM and ENTL data [click to play animated gif]](NSCGLM1/GLM_withCG_start20170430004115.000_end_20170430004125.000slowanim.gif)
![GOES-16 GLM and ENTL data [click to play animated gif]](NSCGLM1/GLM_withCG_start20170430010120.000_end_end20170430010129.000fastanim.gif)
![GOES-16 GLM and ENTL data [click to play animated gif]](NSCGLM1/GLM_withCG_start20170430010120.000_end_end20170430010129.000slowanim.gif)