
1-minute Mesoscale Domain Sector GOES-16 (GOES-East) “Red” Visible (0.64 µm) and “Clean” Infrared Window (10.3 µm) images (above) showed an isolated supercell thunderstorm that produced a few tornadoes and hail as large as 4.00″ in diameter (SPC Storm Reports) across northern Missouri late in the day on 06 May 2023. Pulses of overshooting tops exhibited infrared brightness temperatures of -70ºC or colder (brighter... Read More
![GOES-16 “Red” Visible (0.64 µm) and “Clean” Infrared Window (10.3 µm) images [click to play animated GIF | MP4]](https://cimss.ssec.wisc.edu/satellite-blog/images/2023/05/mo_vis-20230507_004225.png)
GOES-16 “Red” Visible (0.64 µm) and “Clean” Infrared Window (10.3 µm) images [click to play animated GIF | MP4]
1-minute Mesoscale Domain Sector GOES-16 (GOES-East) “Red” Visible (0.64 µm) and “Clean” Infrared Window (10.3 µm) images (above) showed an isolated supercell thunderstorm that produced a few tornadoes and hail as large as 4.00″ in diameter (SPC Storm Reports) across northern Missouri late in the day on 06 May 2023. Pulses of overshooting tops exhibited infrared brightness temperatures of -70ºC or colder (brighter shades of white).
1-minute GOES-16 Infrared images (below) include an overlay of GLM Flash Extent Density — one feature of note was the anvil lightning that eventually extended about 100 miles northeast of the thunderstorm core (which was producing a tornado and 4.00-inch diameter hail at 0042 UTC), stretching into southern Iowa.
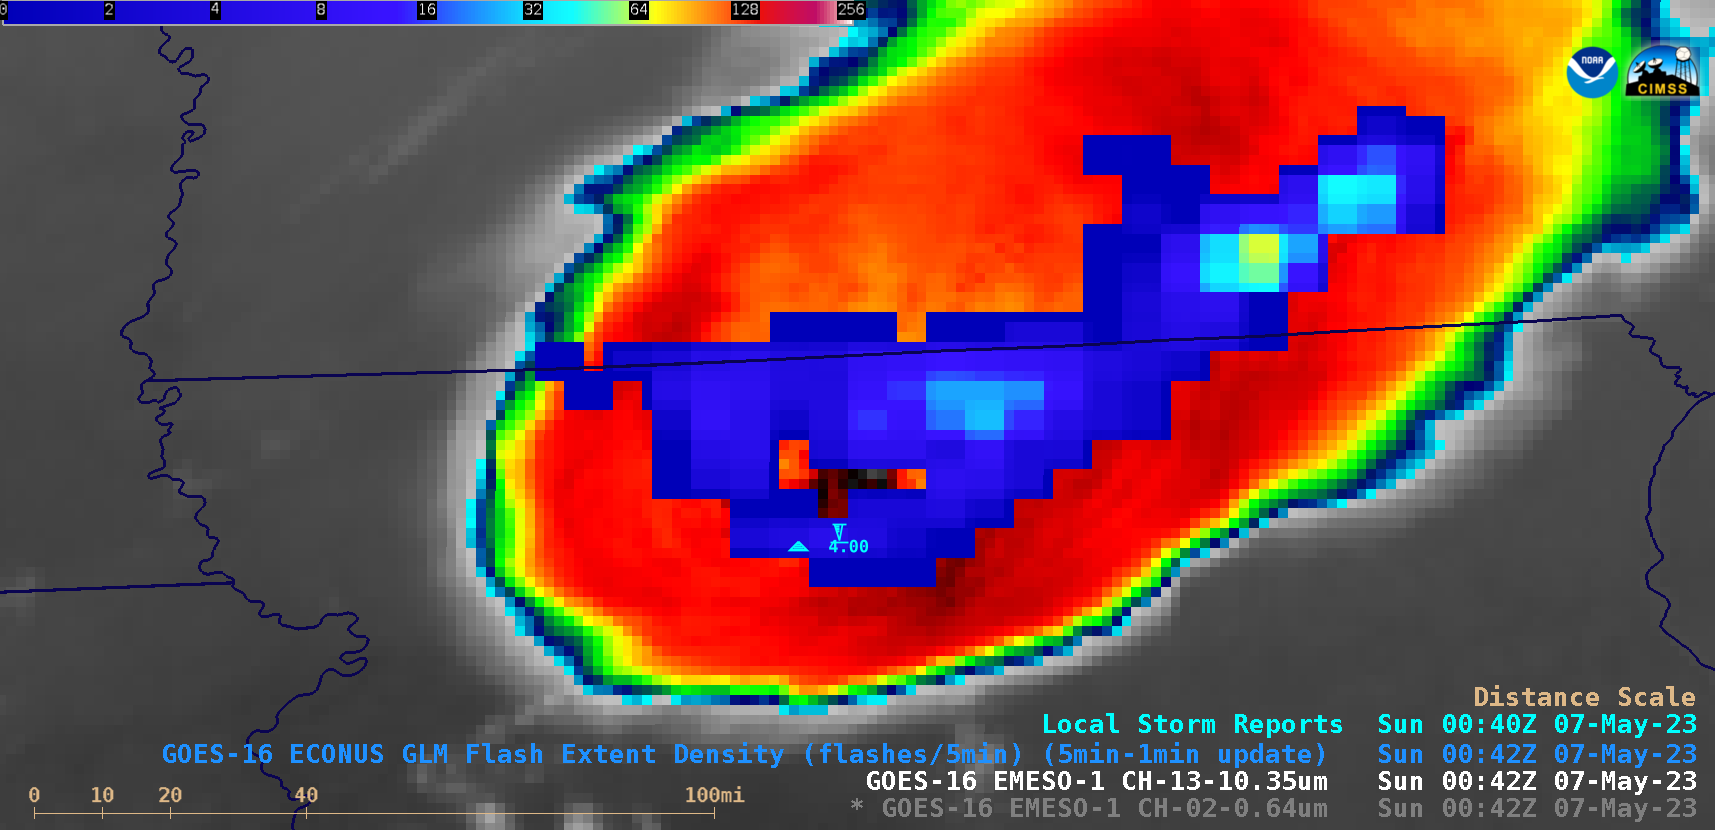
GOES-16 “Clean” Infrared Window (10.3 µm) images, with an overlay of GLM Flash Extent Density [click to play animated GIF | MP4]
GOES-16 Visible images (below) include overlays of Total Precipitable Water, Lifted Index and Convective Available Potential Energy (CAPE) derived products — showing that the thunderstorm was moving into an environment of moisture and instability, helping to sustain its intensity.
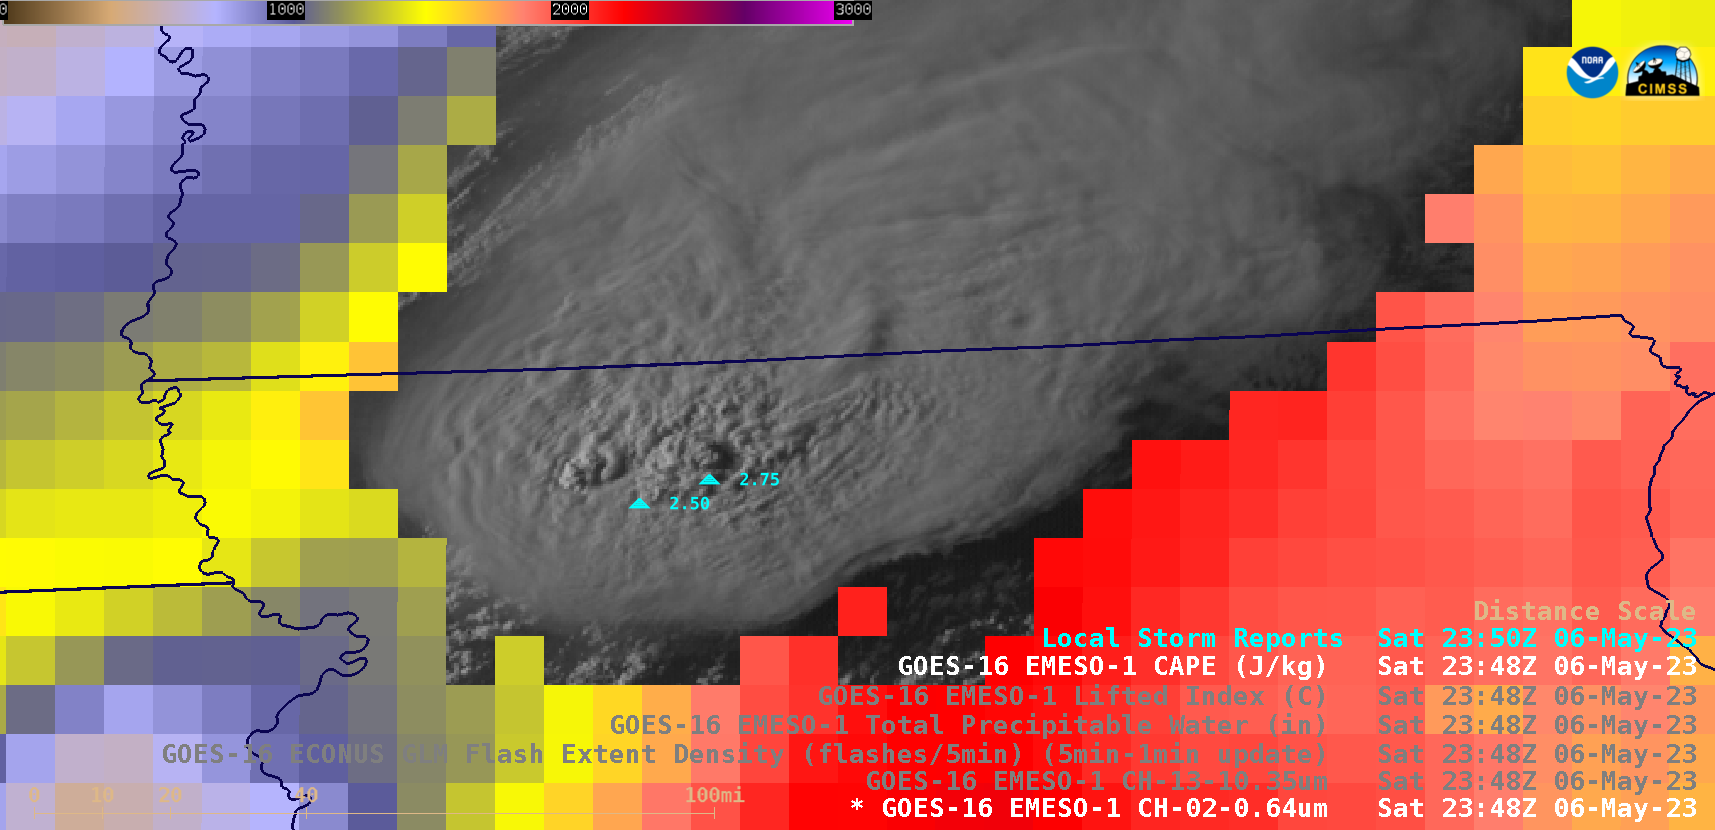
GOES-16 “Red” Visible (0.64 µm) images, with overlays of Total Precipitable Water, Lifted Index and Convective Available Potential Energy (CAPE) derived products [click to play animated GIF | MP4]
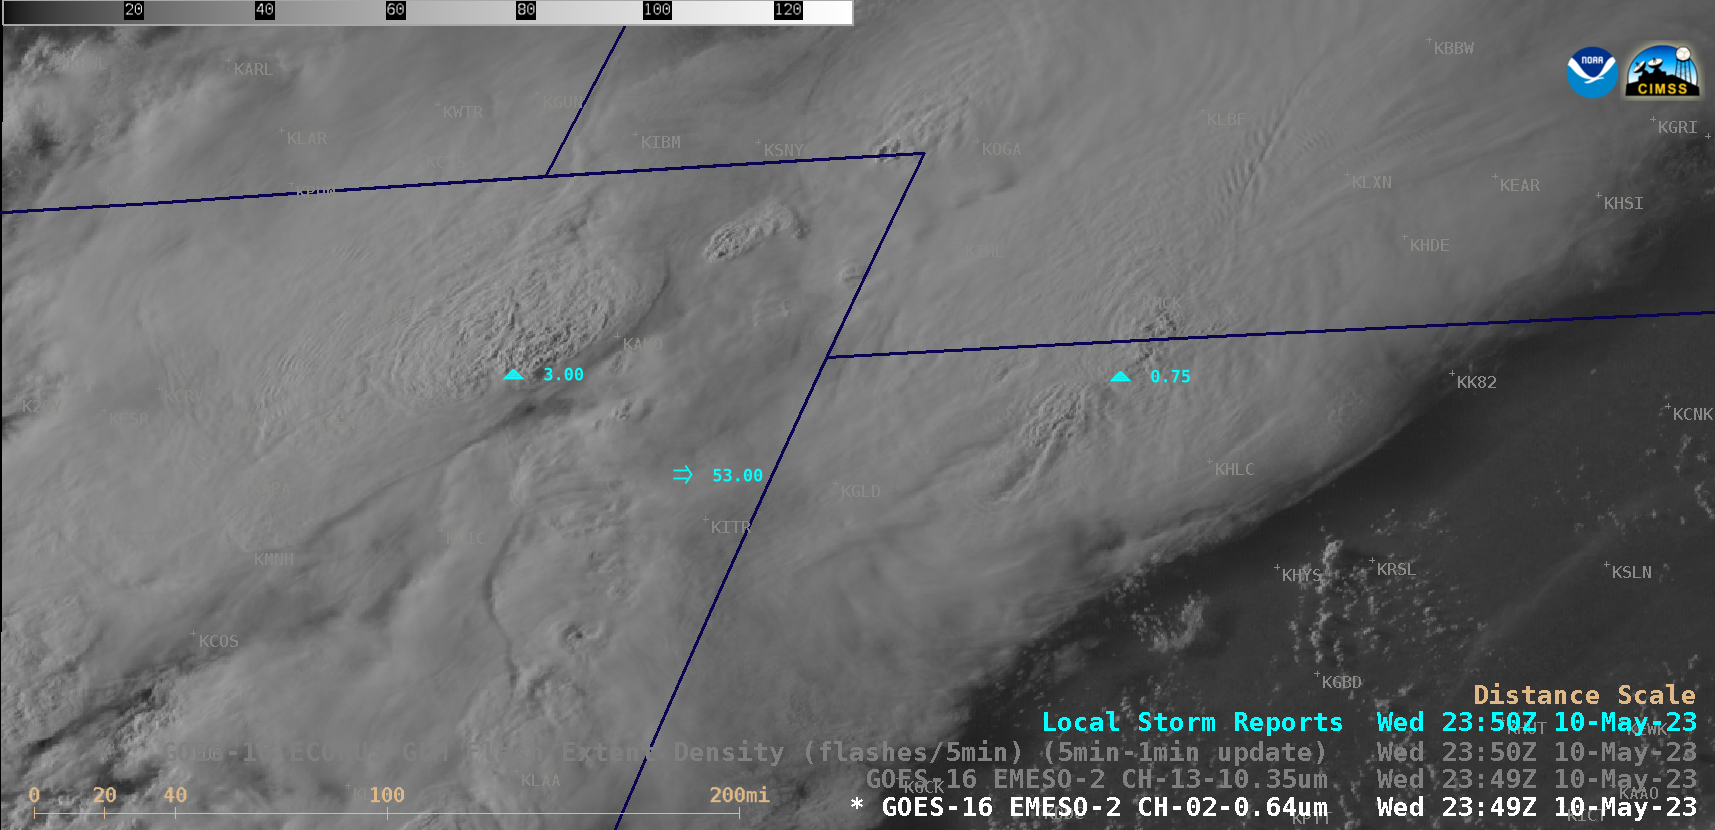
Farther to the west, thunderstorms produced hail and damaging winds across parts of north-central and southeast Nebraska, as seen in 1-minute GOES-16 Visible and Infrared images (below). One notable feature of interest was the cooler (lighter shades of gray) west-to-east oriented swath of hail on the ground in the wake of the southern Nebraska storm — even though that storm was initially producing primarily small-diameter hail (1.00 inch or less), that hail fell at a high enough rate to accumulate and remain on the ground for several hours. Another similar (but more subtle) southwest-to-northeast oriented swath of accumulating hail was evident in the wake of the storm over north-central Nebraska.
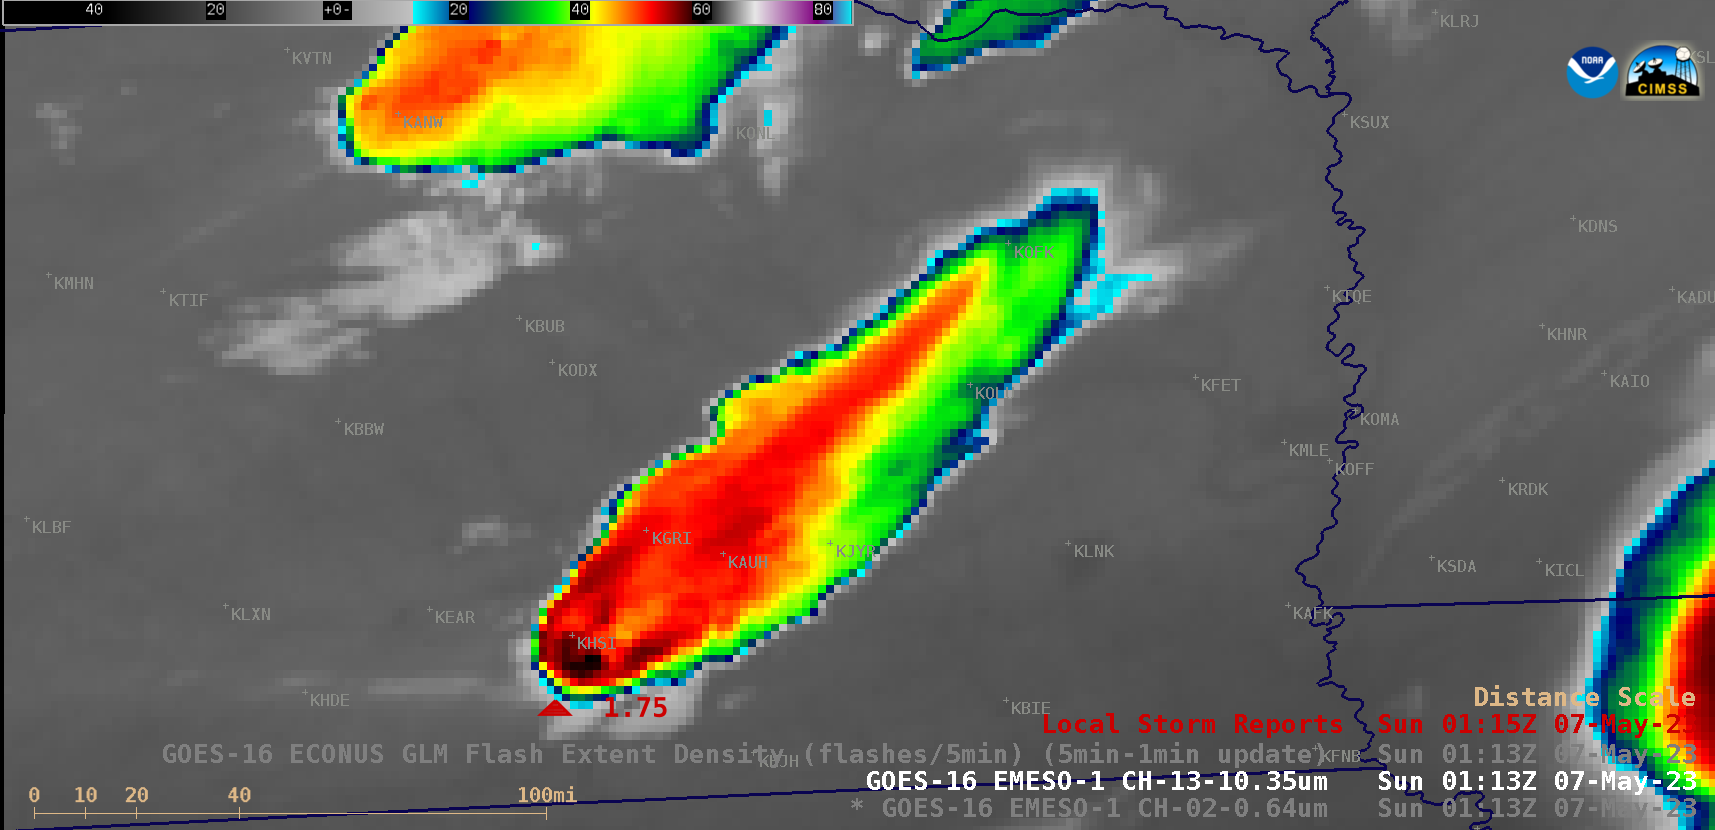
GOES-16 “Red” Visible (0.64 µm) and “Clean” Infrared Window (10.3 µm) images, with an overlay of GLM Flash Extent Density [click to play animated GIF | MP4]
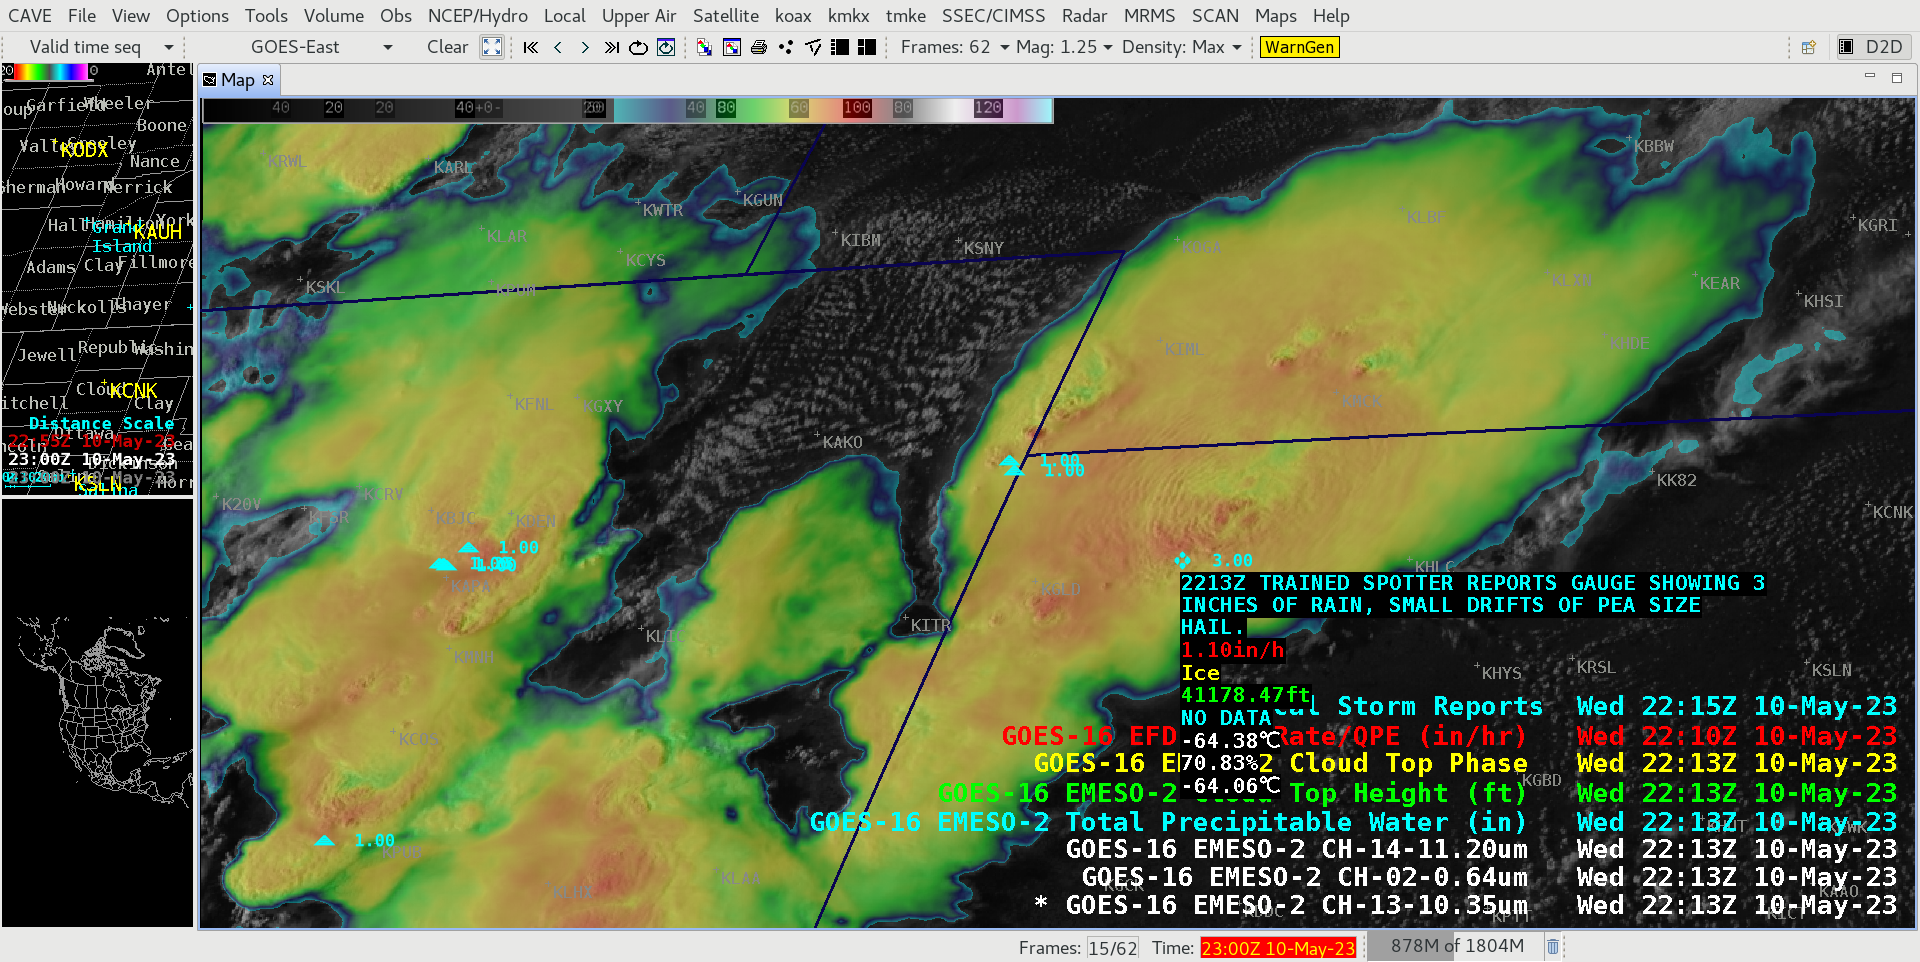
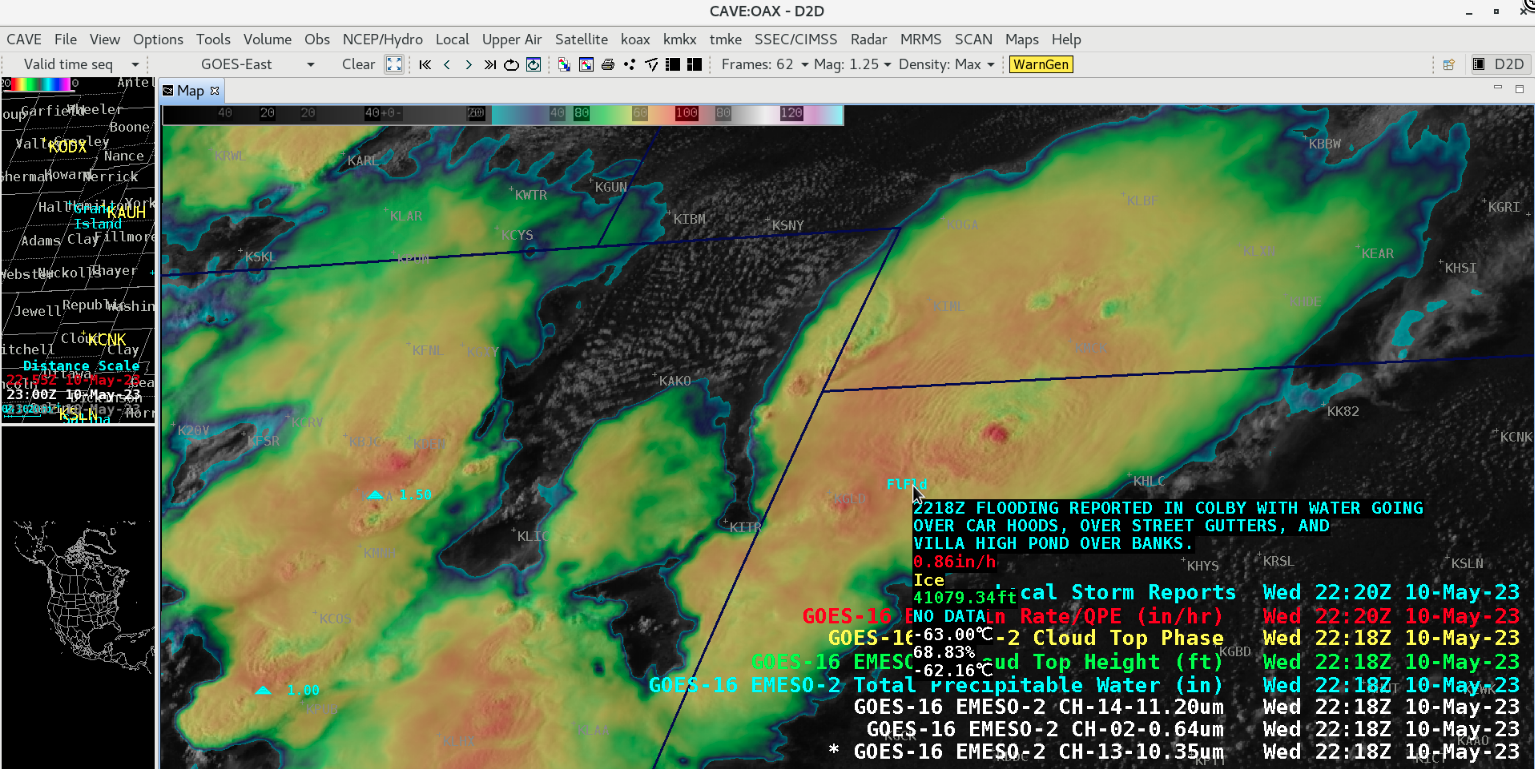
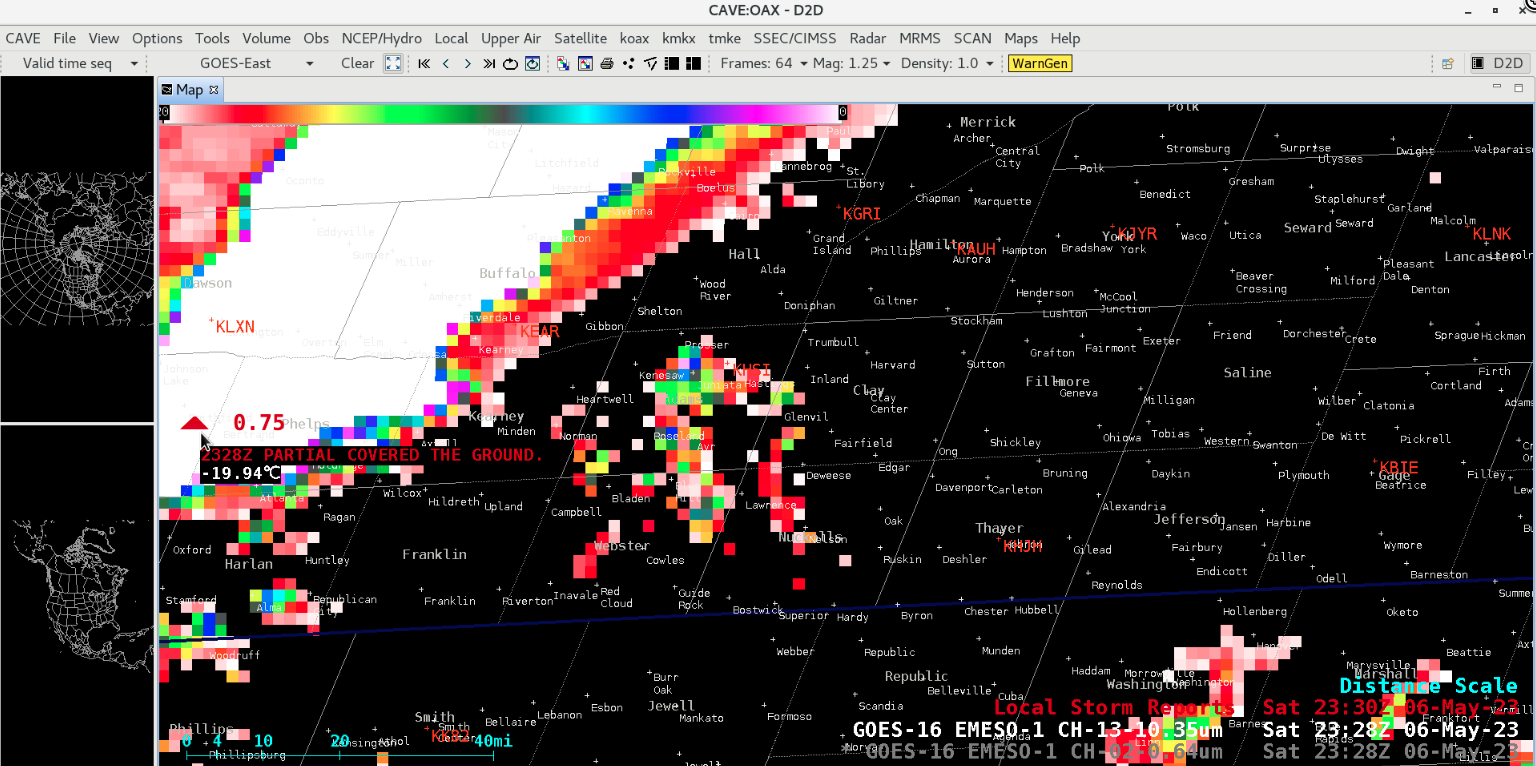
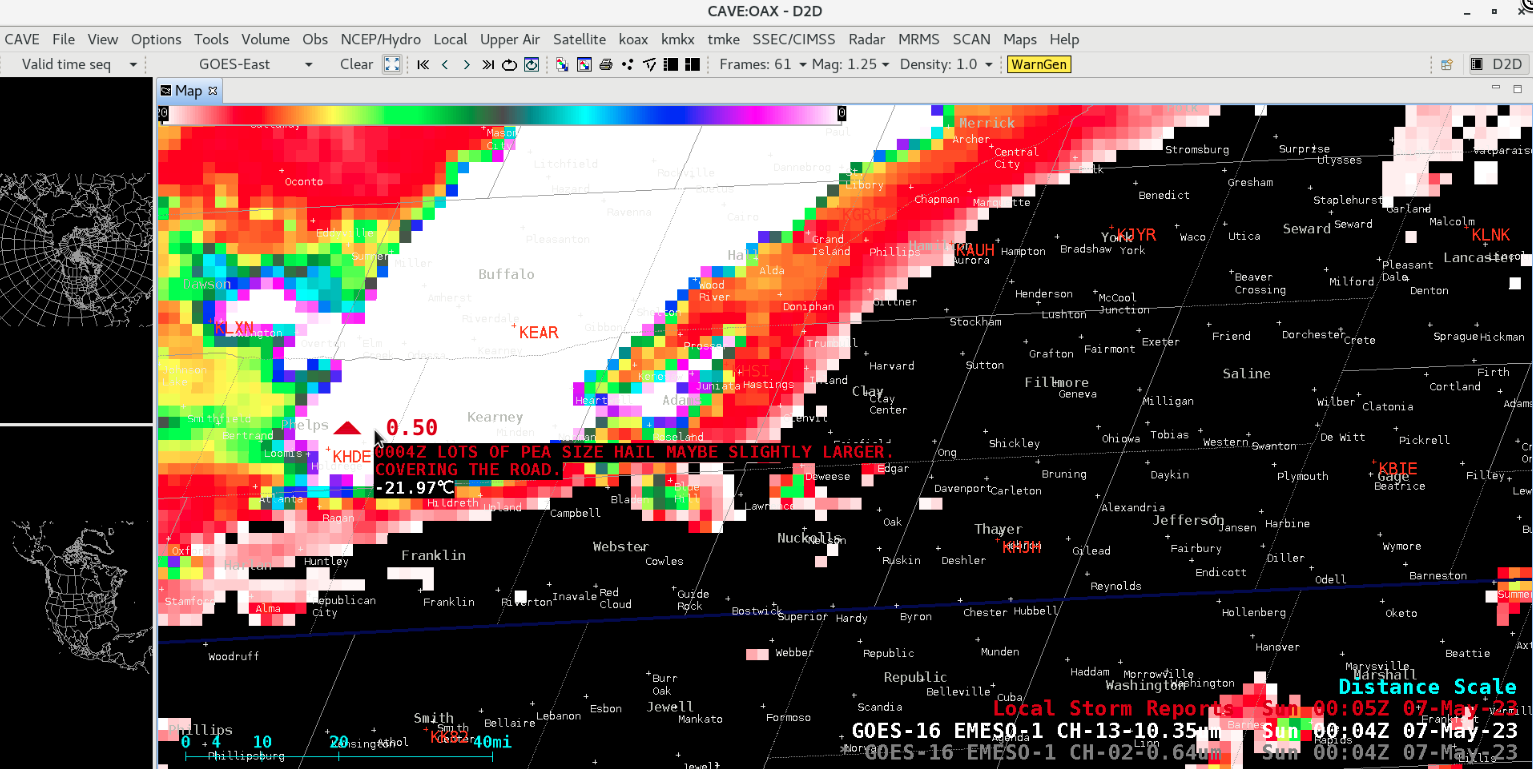
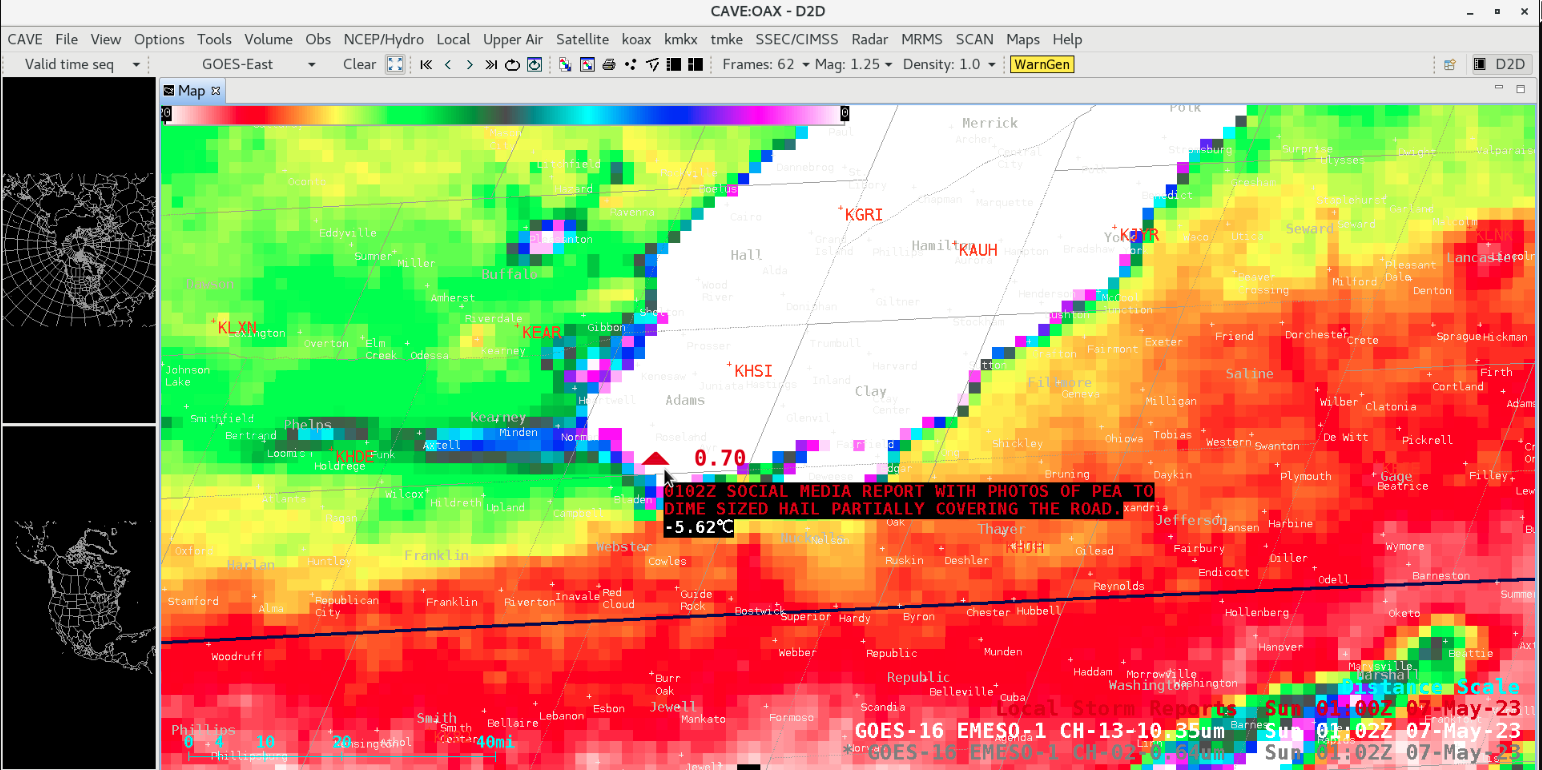
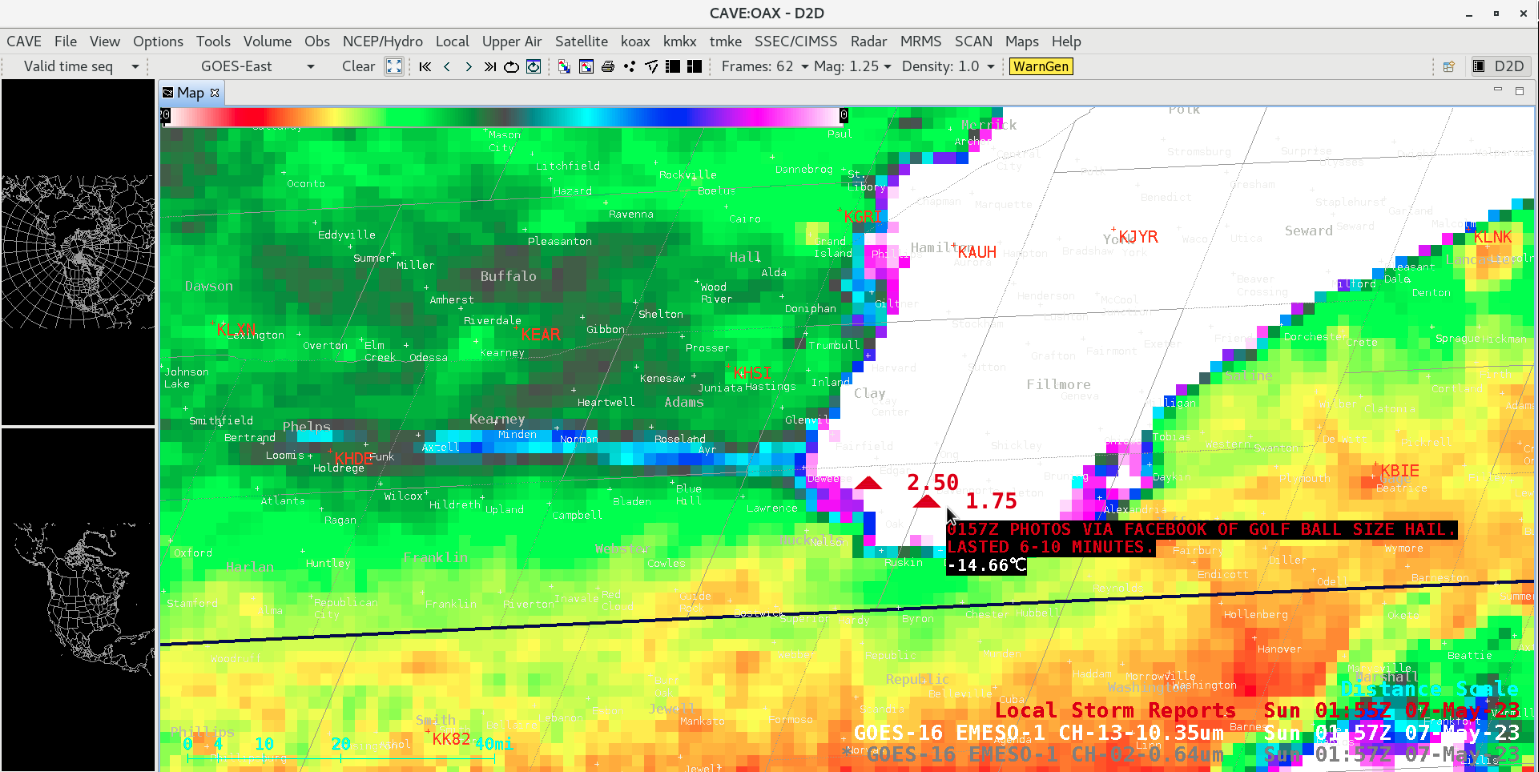
A closer view of the southern Nebraska storm is shown below, using 1-minute GOES-16 Infrared images with a color enhancement tailored to highlight the colder swath of hail accumulation (brighter shades of cyan to darker shades of blue). Surface 10.3 µm infrared brightness temperatures within the narrow hail swath were in the 5-8ºC range, in contrast to 10-13ºC over adjacent bare ground. A few Local Storm Reports (2328 UTC | 0004 UTC | 0102 UTC | 0157 UTC) mentioned hail accumulation or a long duration of hail.
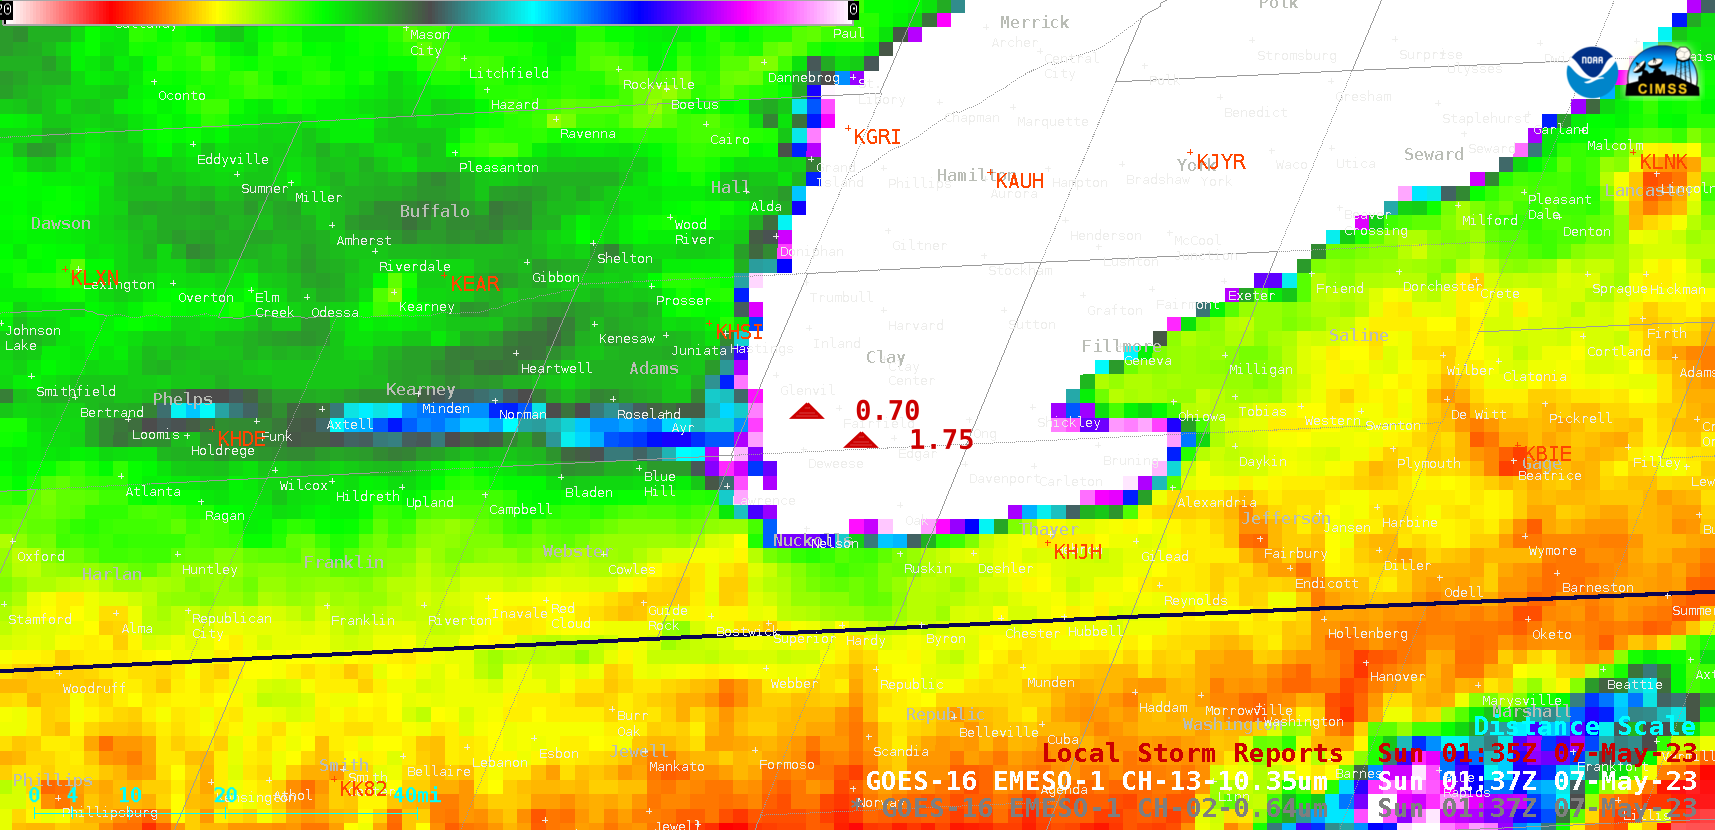
GOES-16 “Clean” Infrared Window (10.3 µm) images, with Local Storm Reports plotted in red [click to play animated GIF | MP4]
1-minute GOES-16 True Color RGB and Nighttime Microphysics RGB images from the CSPP GeoSphere site (below) provided another close-up view of the southern Nebraska storm — its hail swath showed up as pale shades white in the Nighttime Microphysics RGB imagery.
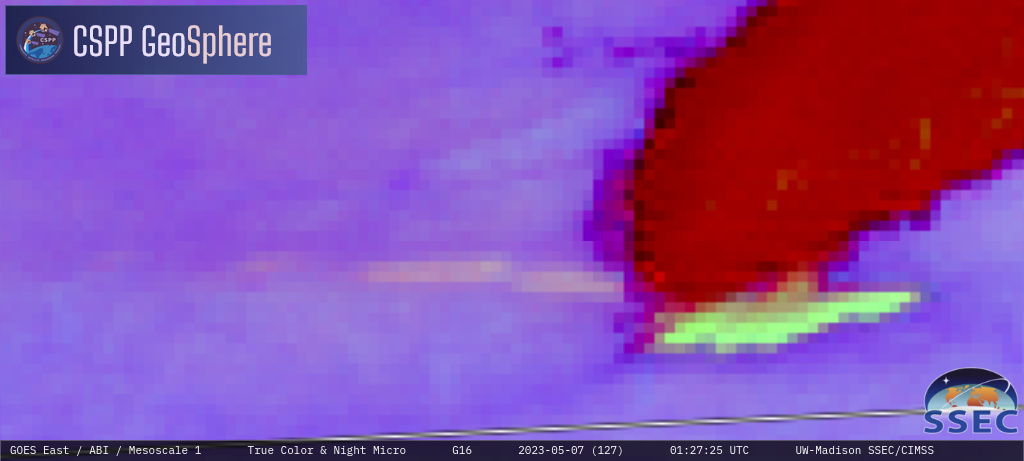
GOES-16 True Color RGB and Nighttime Microphysics RGB images [click to play MP4 animation]
In a toggle between the GOES-16 Land Surface Temperature (LST) derived product at 0000 and 0100 UTC (below), LST values within the narrow hail swath were in the low-middle 50s F (darker shades of blue), compared to the low-middle 60s F (shades of green) over adjacent bare ground. Another cold LST hail swath was apparent in the wake of the thunderstorm over north-central Nebraska.
GOES-16 Land Surface Temperature derived product at 0000 and 0100 UTC [click to enlarge]
Thanks to NWS Hastings for bringing this interesting feature to our attention!
View only this post
Read Less


![GOES-16 “Red” Visible (0.64 µm) and “Clean” Infrared Window (10.3 µm) images [click to play animated GIF | MP4]](https://cimss.ssec.wisc.edu/satellite-blog/images/2023/05/230506_goes16_visible_infrared_localStormReports_MO_anim.gif)


