Cyclone Jasper in the Coral Sea
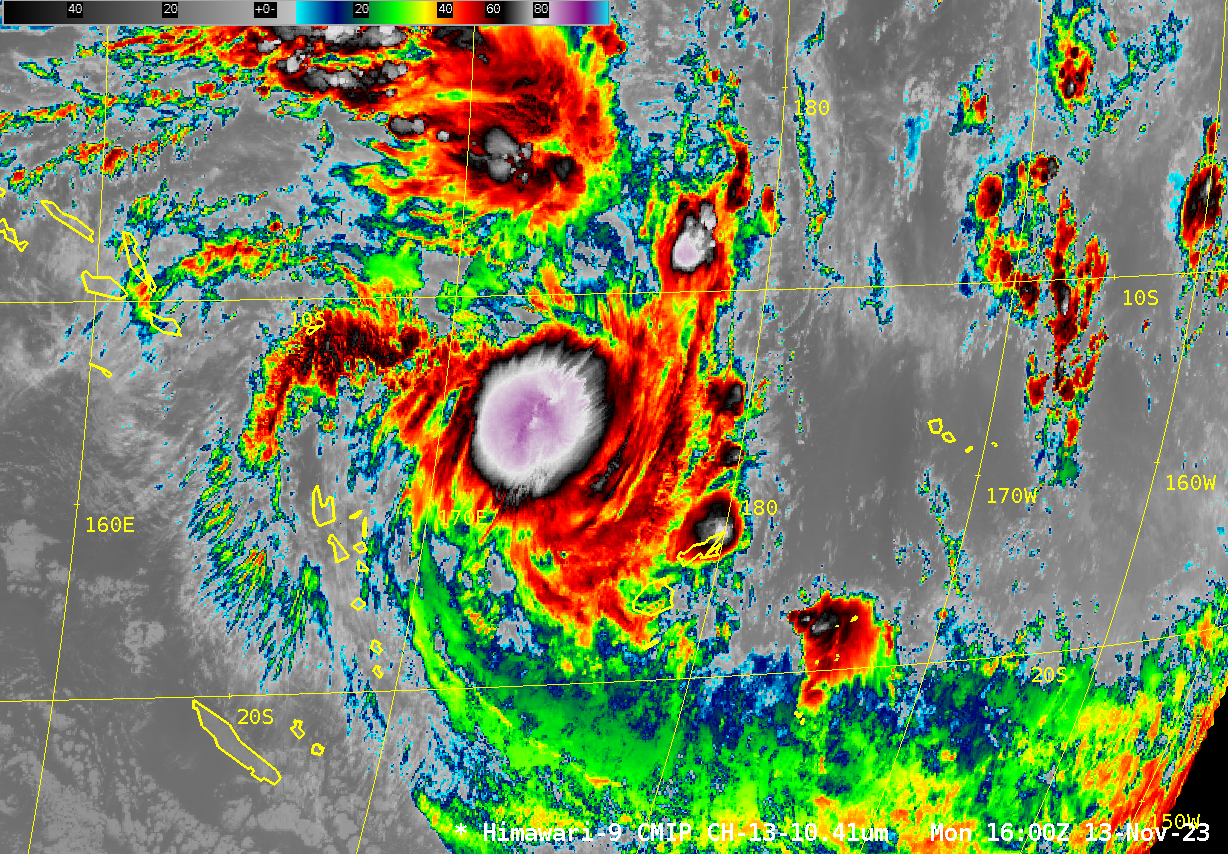
Target Sector (2.5-minute interval) JMA Himawari-9 AHI Clean Infrared Window (10.4 µm) images (above) showed the gradual development of a ragged eye with Cyclone Jasper as the storm moved southward across the Coral Sea on 07 December 2023. Intermittent convective bursts within the eyewall contained a few overshooting tops that exhibited infrared brightness temperatures around -90ºC (yellow... Read More
