Turbulence near the axis of a strong subtropical jet stream
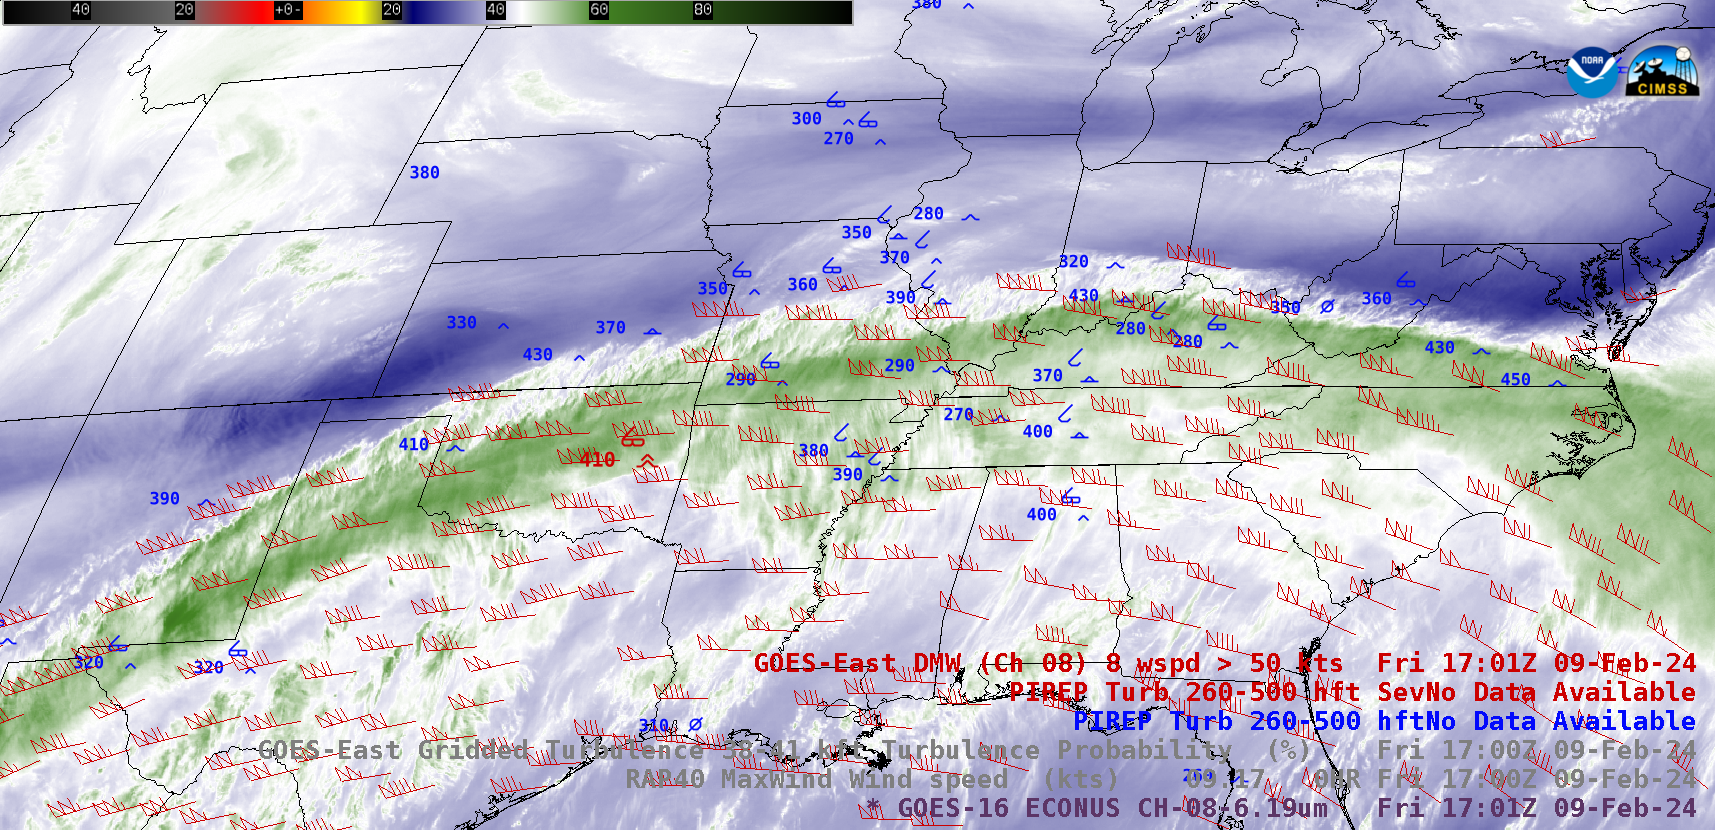
GOES-16 (GOES-East) Upper-level Water Vapor (6.2 µm) images that included plots of Derived Motion Winds along with Pilot Reports (PIREPs) of turbulence (above) showed that there was widespread turbulence in the general vicinity of the axis of an anomalously-strong subtropical jet stream moving across the US on 09 February 2024. Wind speeds along the axis... Read More
