Consolidation of ice within Green Bay
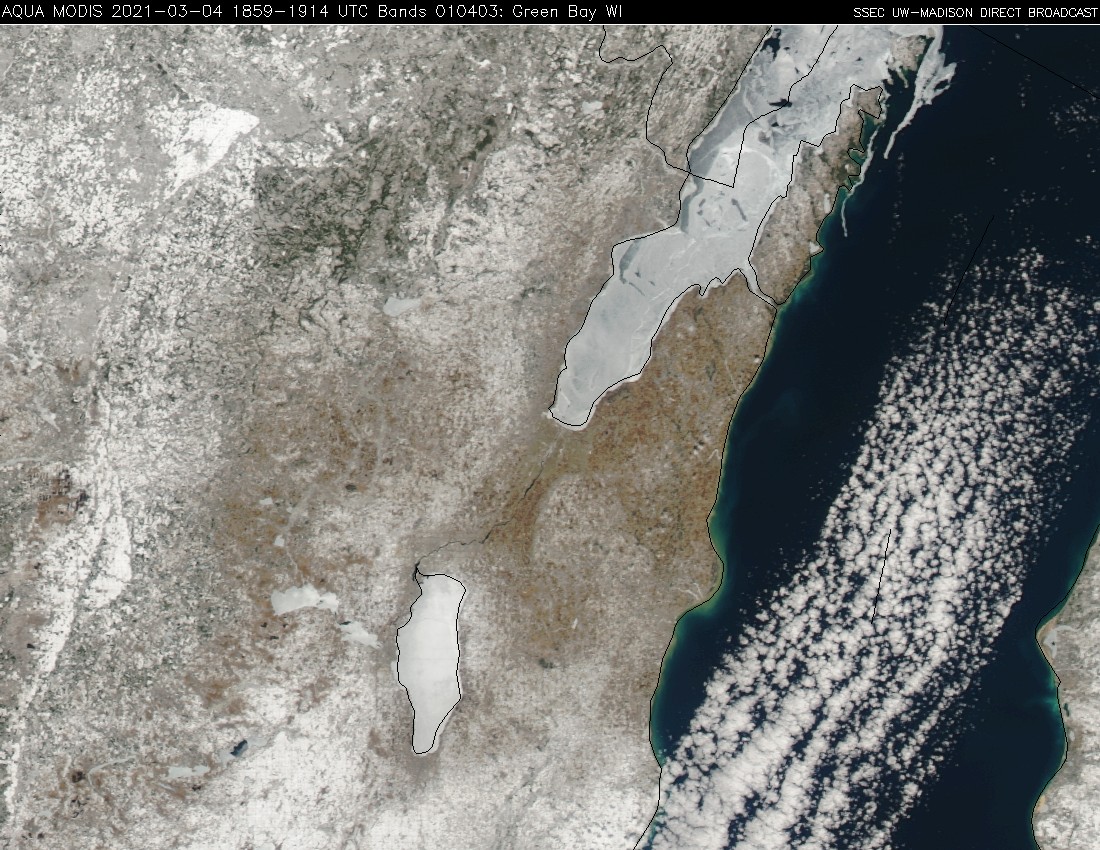
GOES-16 (GOES-East) “Red” Visible (0.64 µm) images (above) showed the wind-driven consolidation of ice within Green Bay during the 03 March – 04 March 2021 period. Northerly winds in the wake of a cold frontal passage on 03 March led to the fracturing of land-fast ice in the far northern portion of Green Bay... Read More