Rapidly intensifying Hurricane Force low off the US West Coast
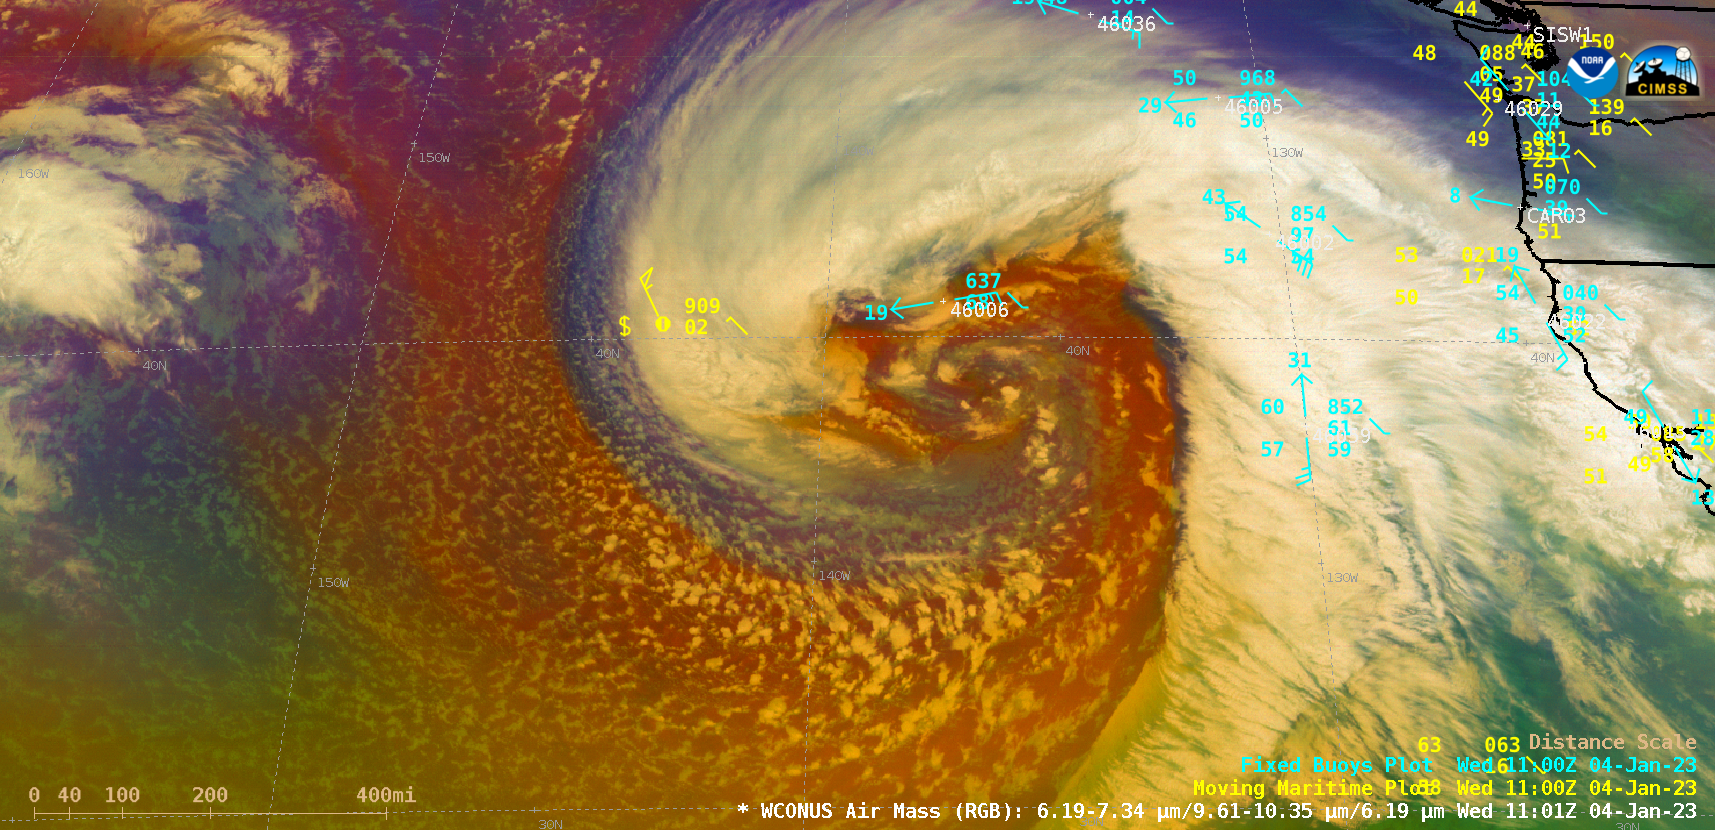
GOES-17 — and GOES-18, beginning at 1801 UTC on 04 January (after GOES-18 became the operational GOES-West satellite) — Air Mass RGB images (above) showed a rapidly-intensifying Hurricane Force low pressure system (surface analyses) over the East Pacific Ocean as it approached the US West Coast during the 03 January – 04 January 2023 period... Read More
