ProbSevere products over the Southern Plains
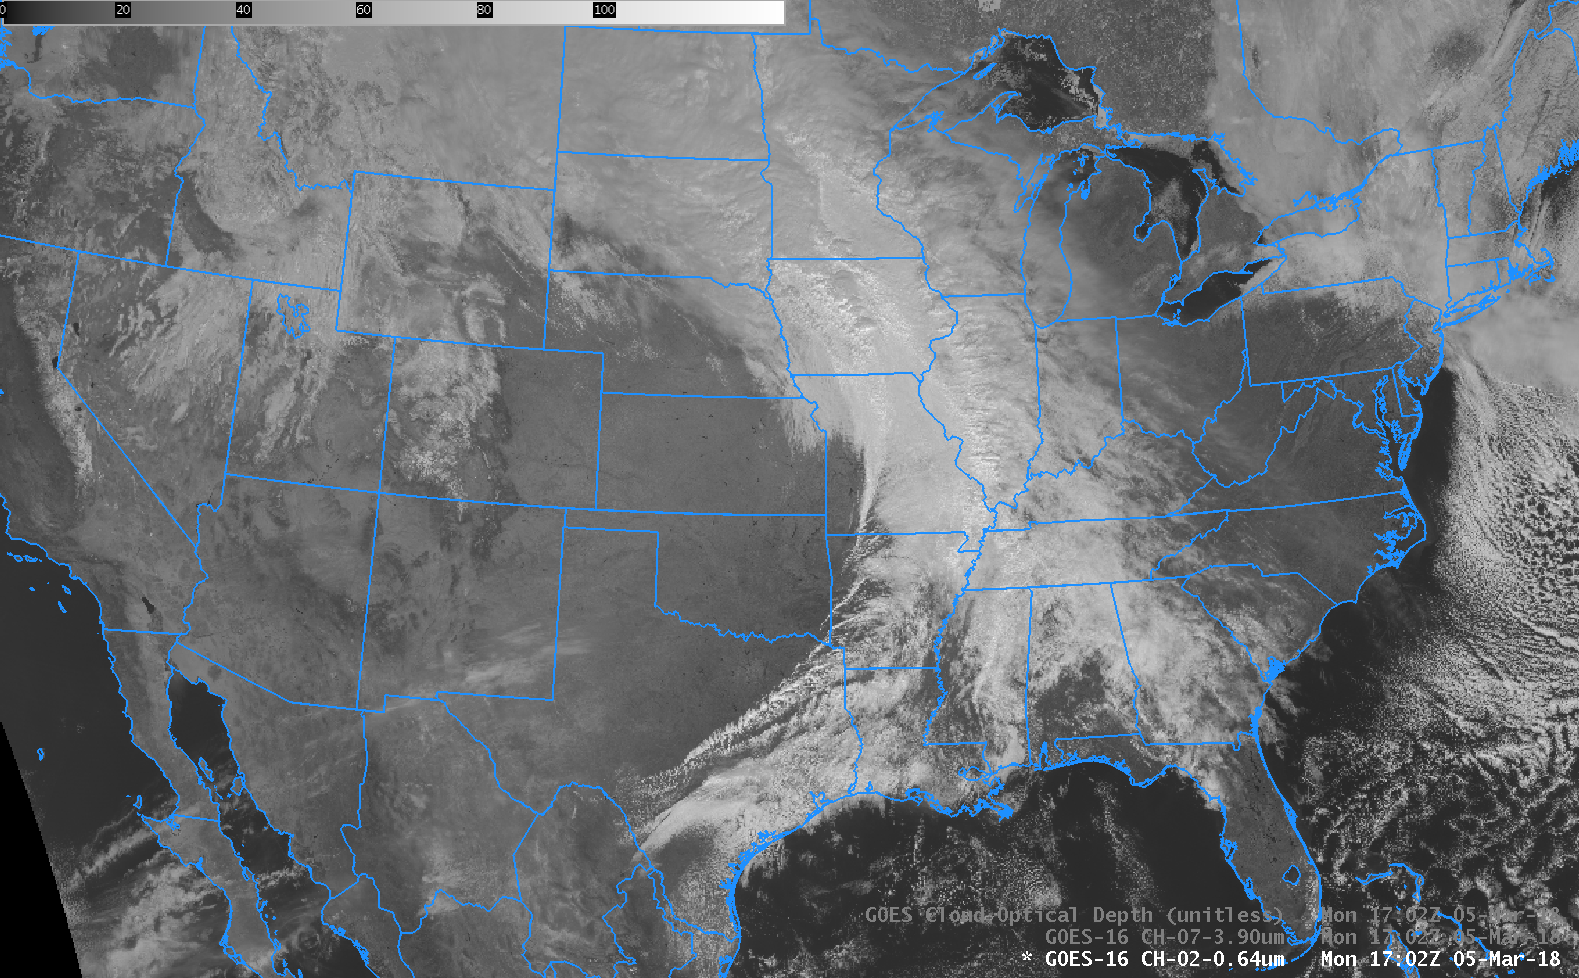
The NOAA/CIMSS ProbSevere portfolio contains AI models for nowcasting convective weather. I’ll use Monday’s severe weather over the Southern Plains to highlight several of them.A strong cold front spawned numerous severe-hail, wind, and tornado producing storms over Texas and Oklahoma, aided by very large values of convective available potential energy... Read More