Pyrocumulonimbus cloud in Australia
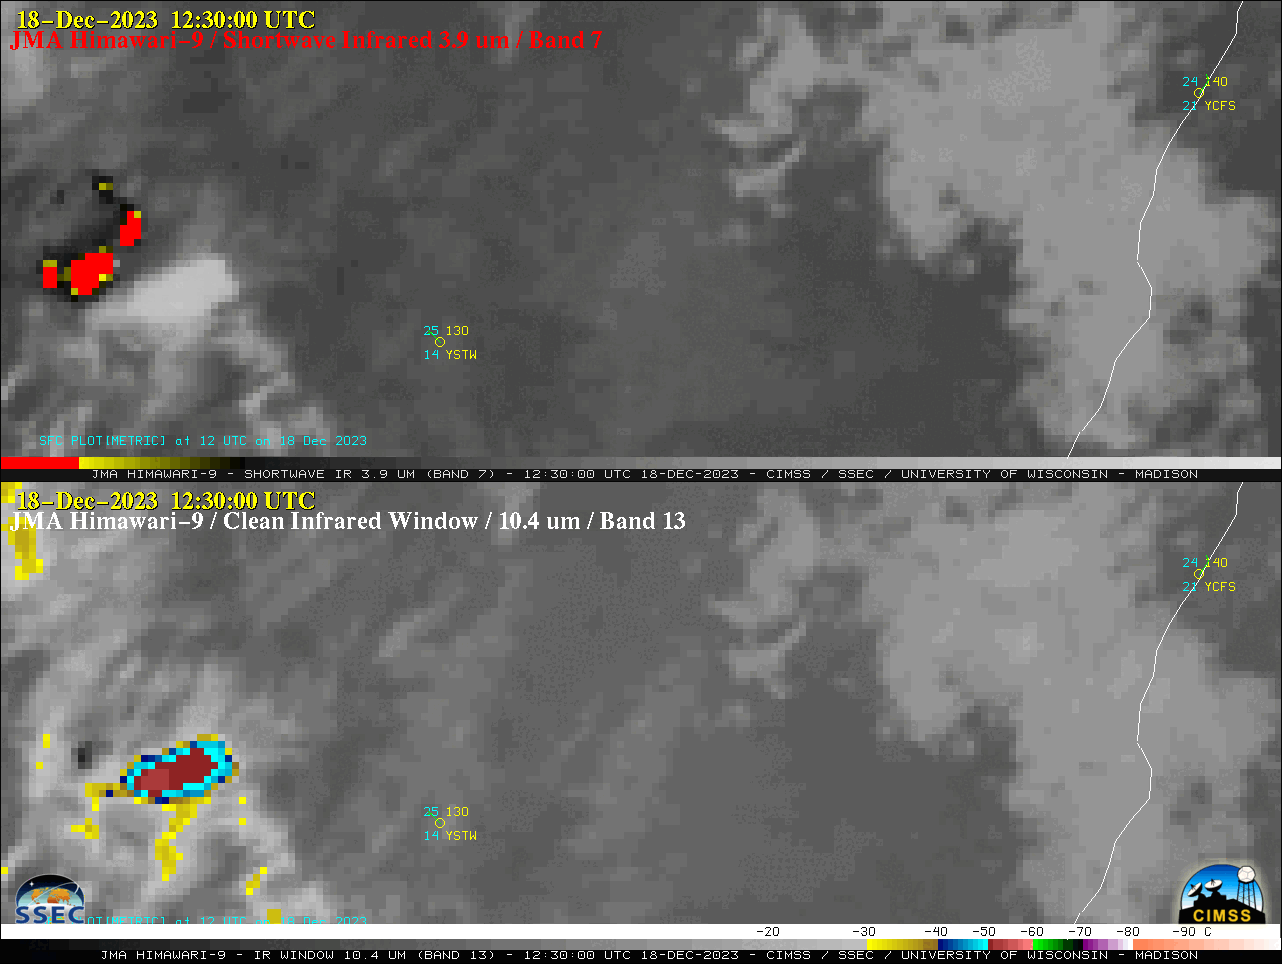
10-minute JMA Himawari-9 AHI Shortwave Infrared (3.9 µm) and Clean Infrared Window (10.4 µm) images (above) showed he development of a pyrocumulonimbus (pyroCb) cloud northwest of Tamworth (YSTW) in New South Wales, Australia on 18 December 2023. The coldest cloud-top Infrared Window brightness temperature was -53.4ºC at 1230 UTC.The southern flank of... Read More
