Rope cloud in the East Pacific Ocean
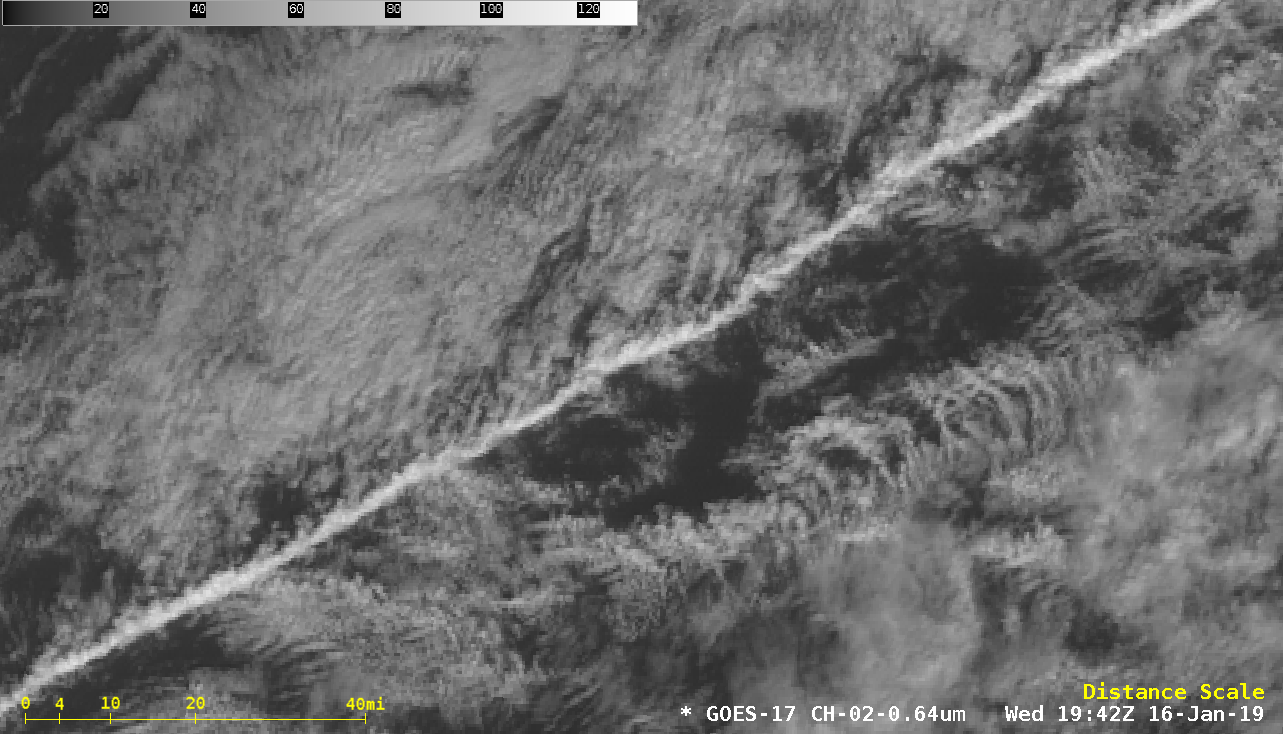
* GOES-17 images shown here are preliminary and non-operational *An 1802 UTC GOES-17 “Red” Visible (0.64 µm) image with an overlay of the 12 UTC surface analysis (above) revealed a well-defined rope cloud which stretched for nearly 1000 miles, marking the cold front position at the time of the image. Rope clouds... Read More