Pyrocumulonimbus clouds in the Northwest Territories
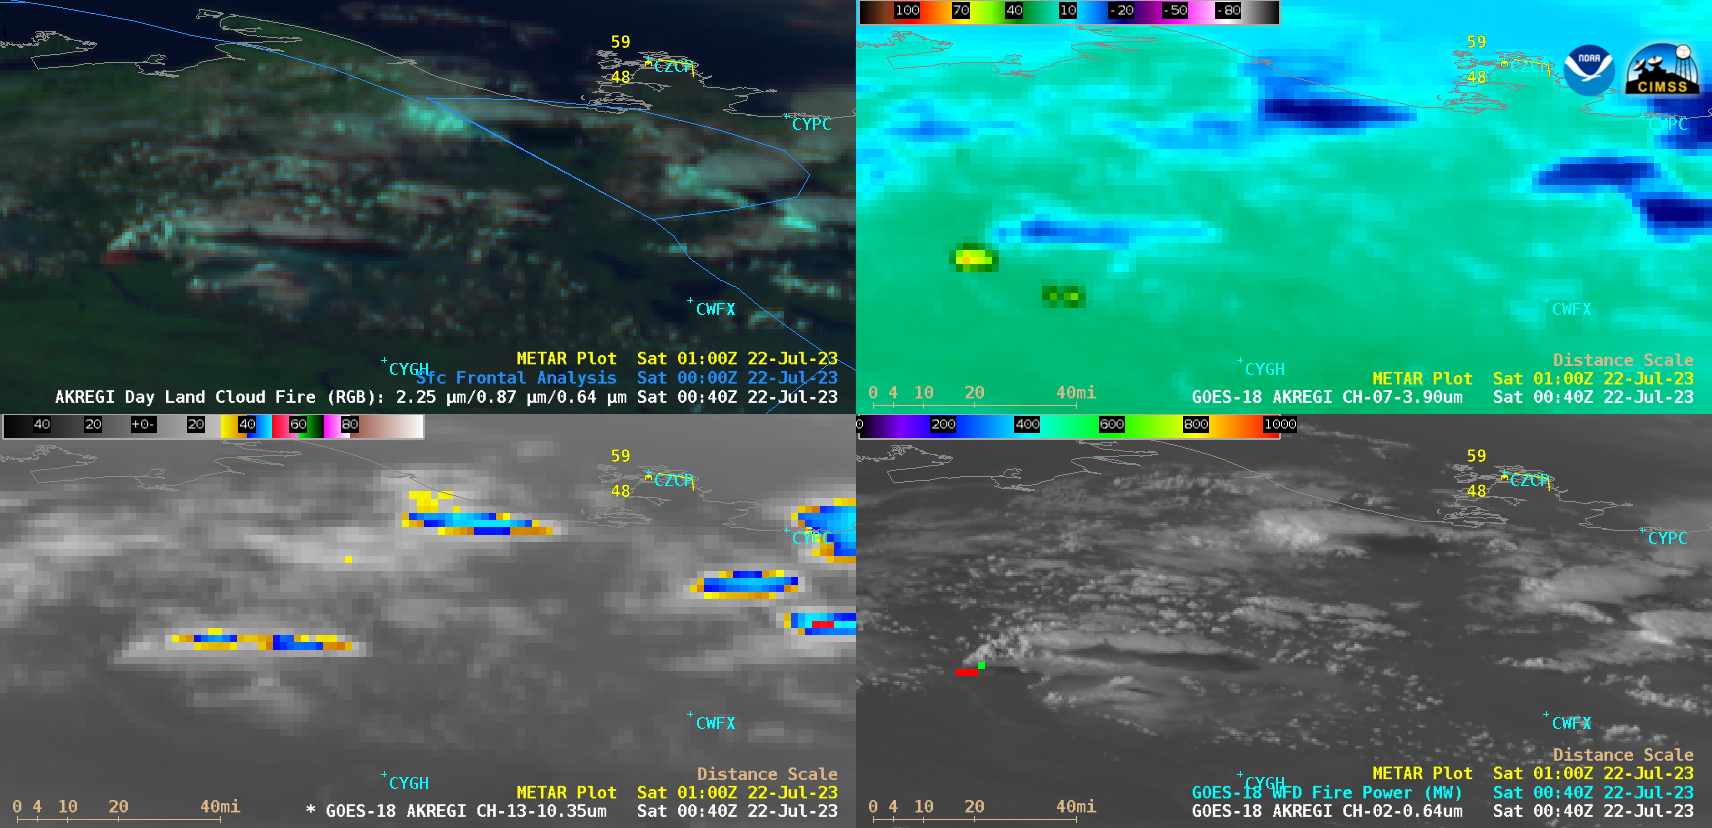
GOES-18 (GOES-West) Day Land Cloud Fire RGB, Shortwave Infrared (3.9 µm), “Clean” Infrared Window (10.3 µm) and Visible images with an overlay of the Fire Power derived product — Fire Power is a component of the GOES Fire Detection and Characterization Algorithm FDCA — (above) showed thermal signatures associated with a wildfire that produced a pair of pyrocumulonimbus (pyroCb)... Read More
