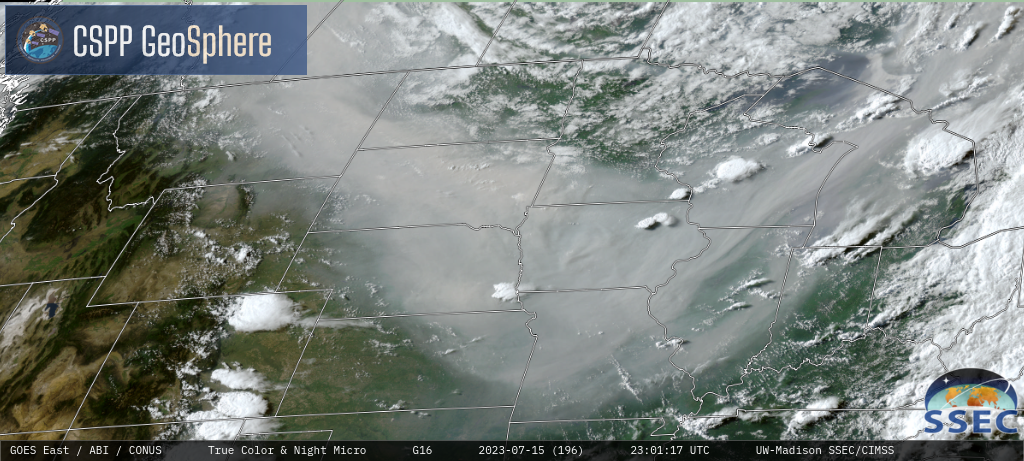
Game Preserve Fire forces evacuations in Huntsville, Texas
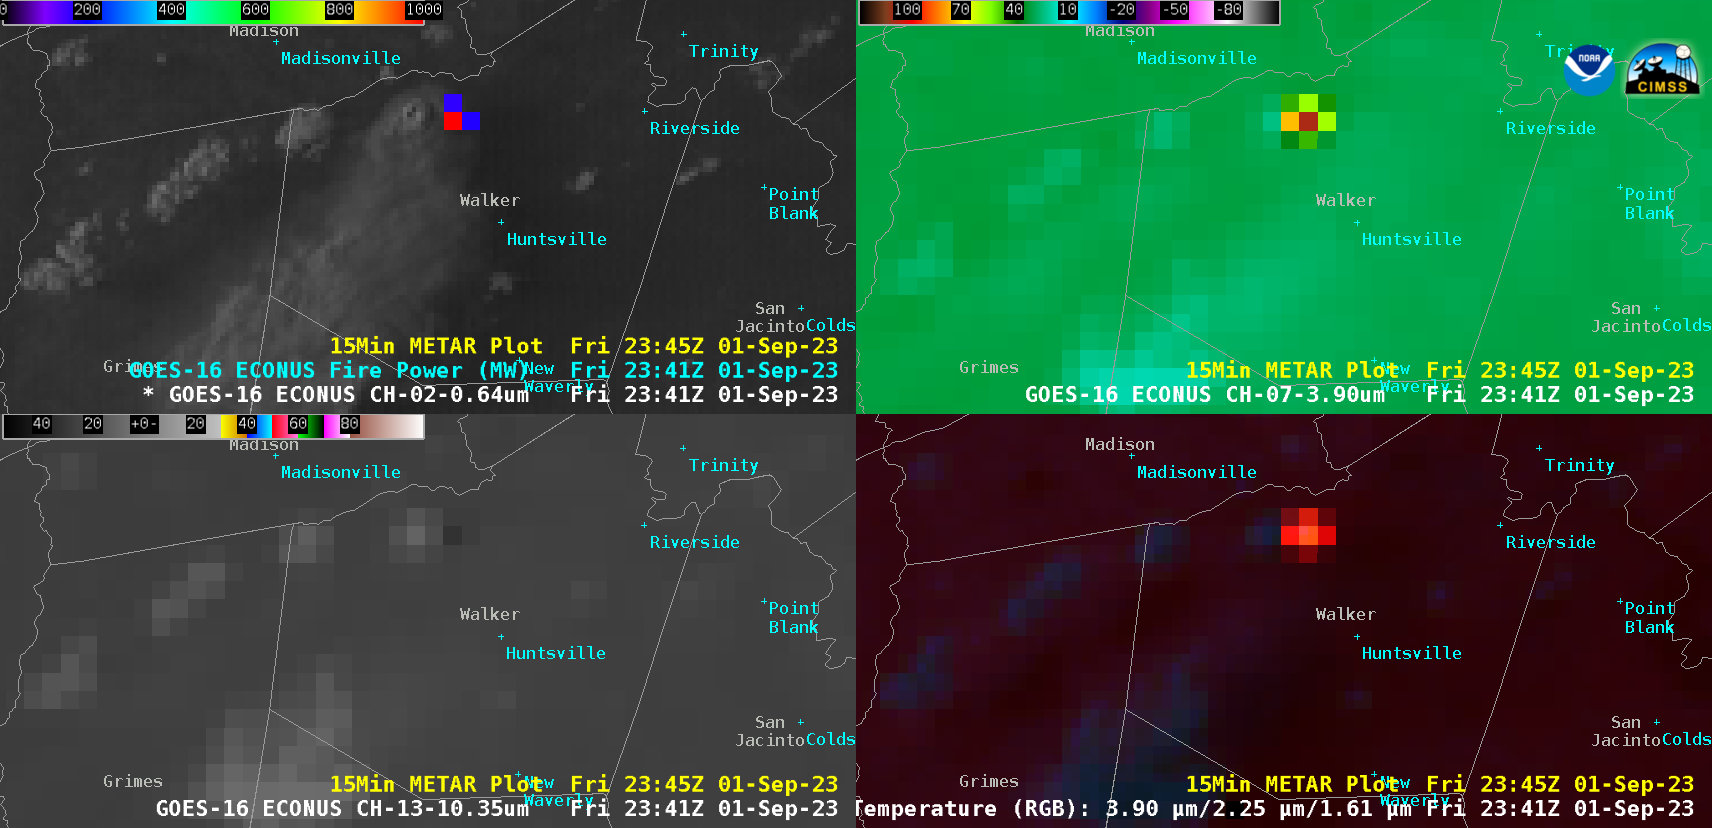
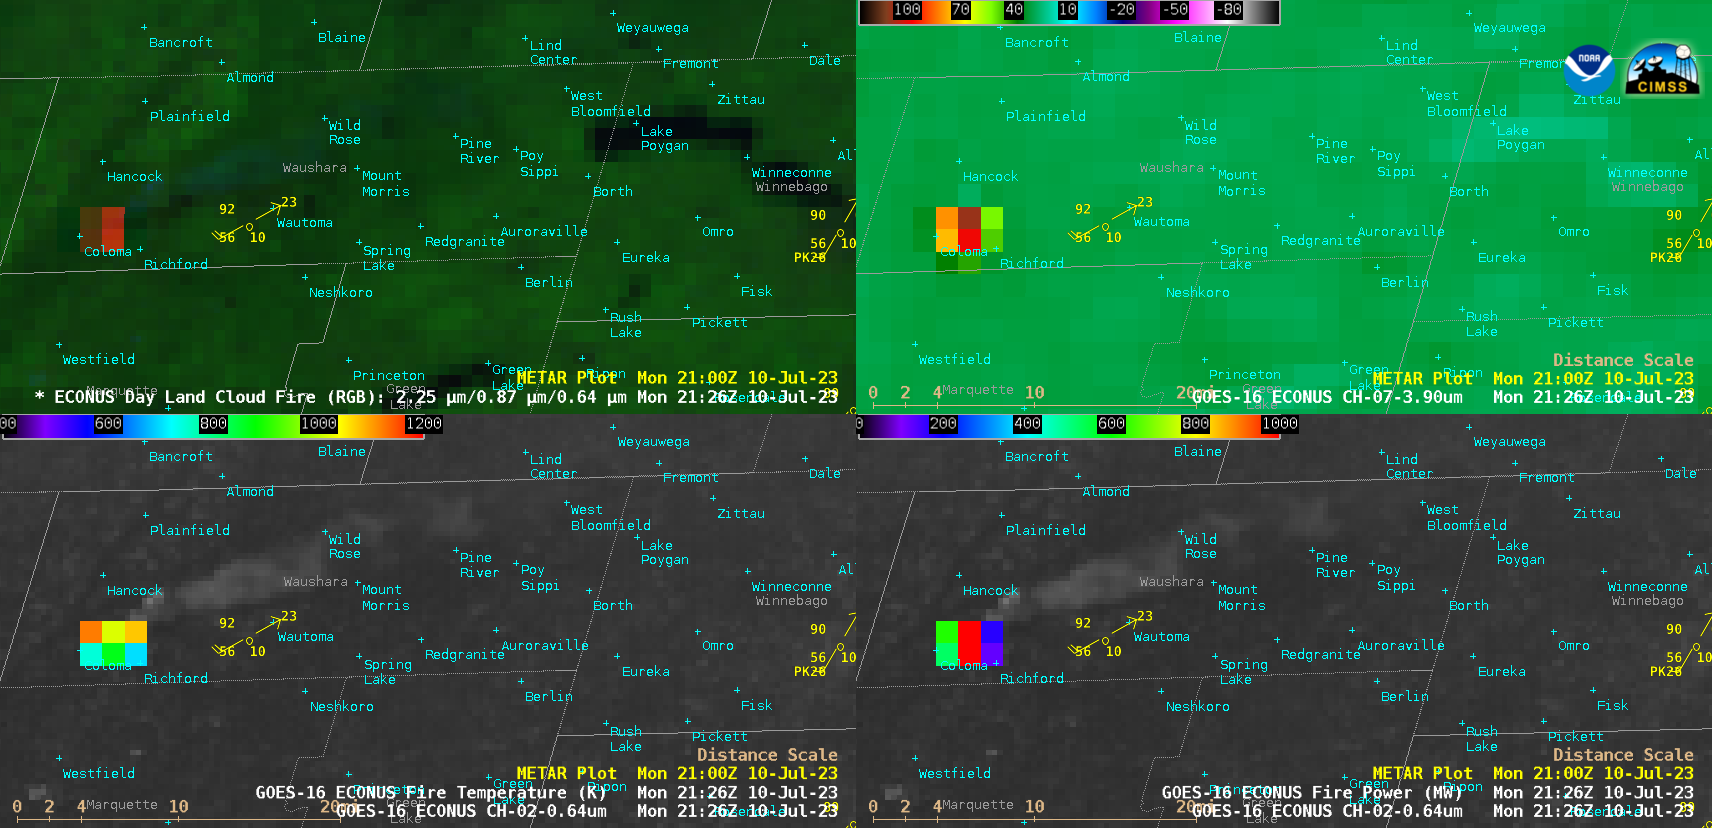
5-minute GOES-16 (GOES-East) “Red” Visible (0.64 µm) + Fire Power derived product (a component of the GOES Fire Detection and Characterization Algorithm FDCA), Shortwave Infrared (3.9 µm), “Clean” Infrared Window (10.3 µm) and Fire Temperature RGB images (above) showed signatures of the Game Preserve Fire in northern Walker County, Texas late in the day on 01 September 2023. The wildfire forced... Read More