Plume of airborne glacial silt from the Copper River Valley in southcentral Alaska
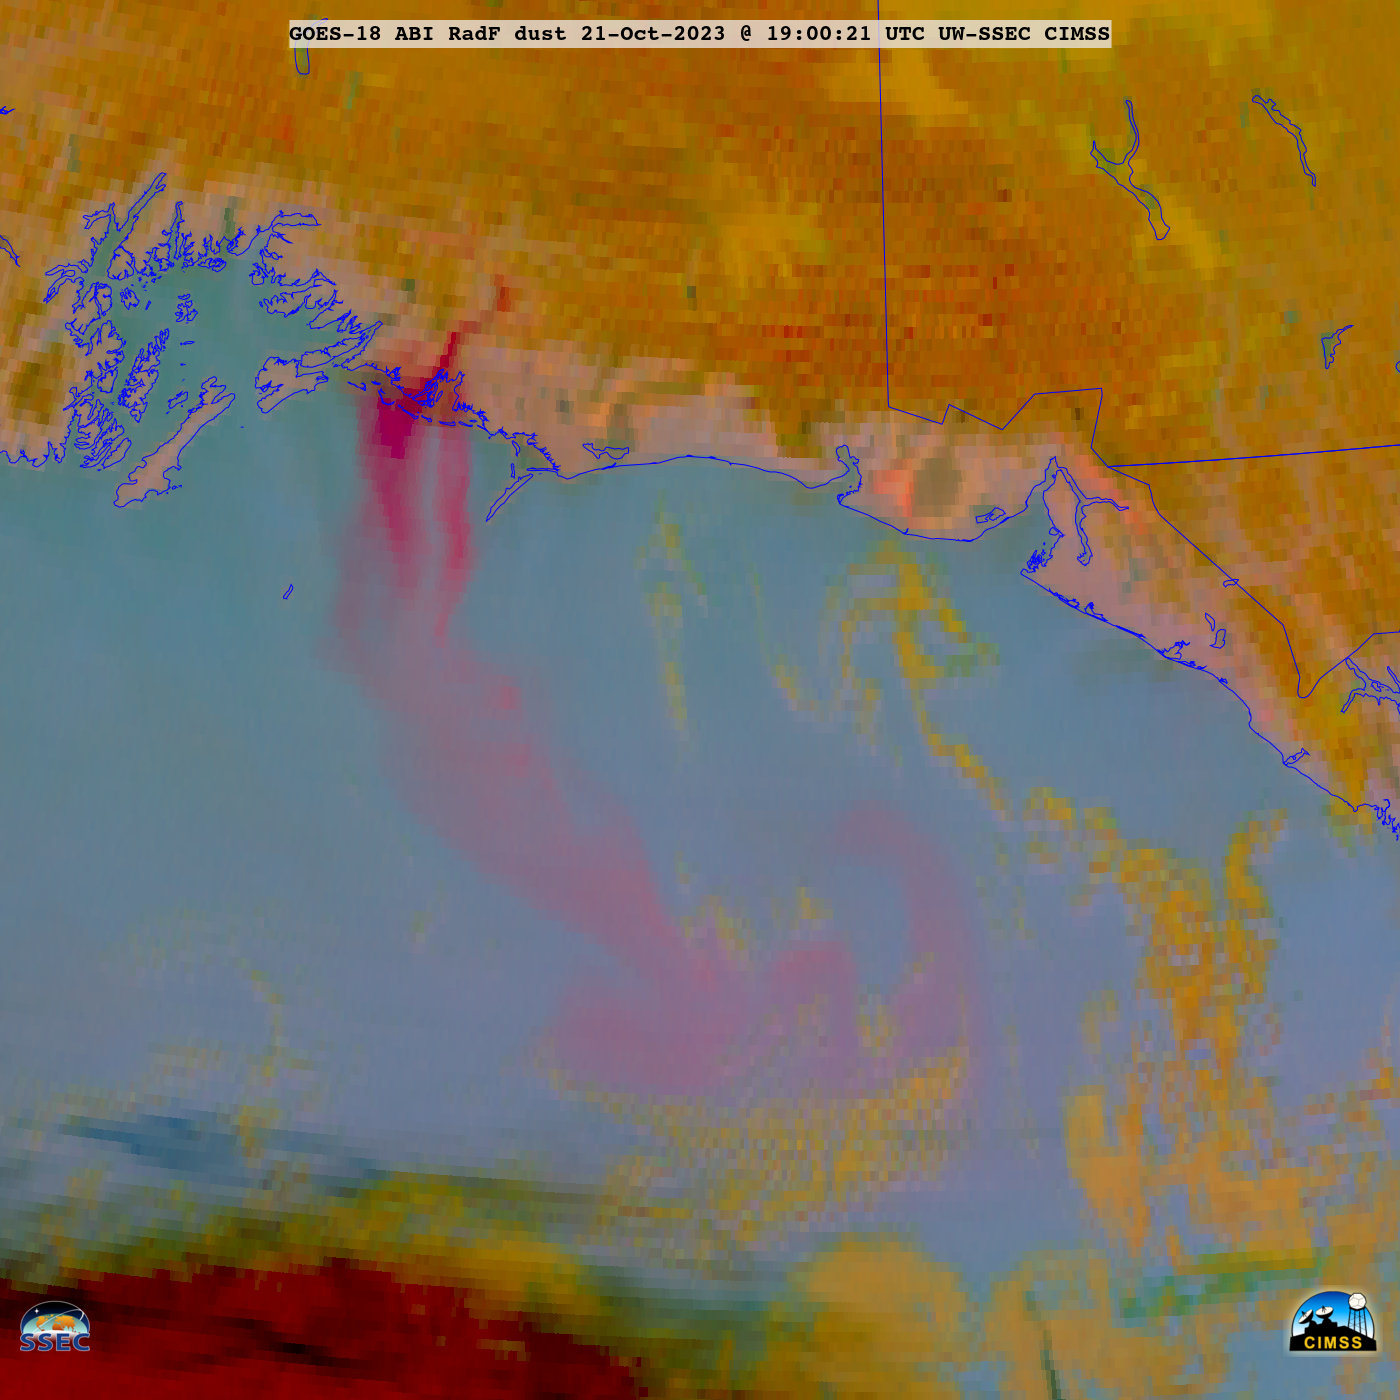
Strong gap winds accelerating out of the Copper River Valley — located along the coast of southcentral Alaska — were lofting fine particles of glacial silt/sand, and transporting those aerosols southward across the Gulf of Alaska during 20-22 October 2023. 10-minute GOES-18 (GOES-West) Dust Red-Green-Blue (RGB) images created using Geo2Grid (above) displayed the... Read More