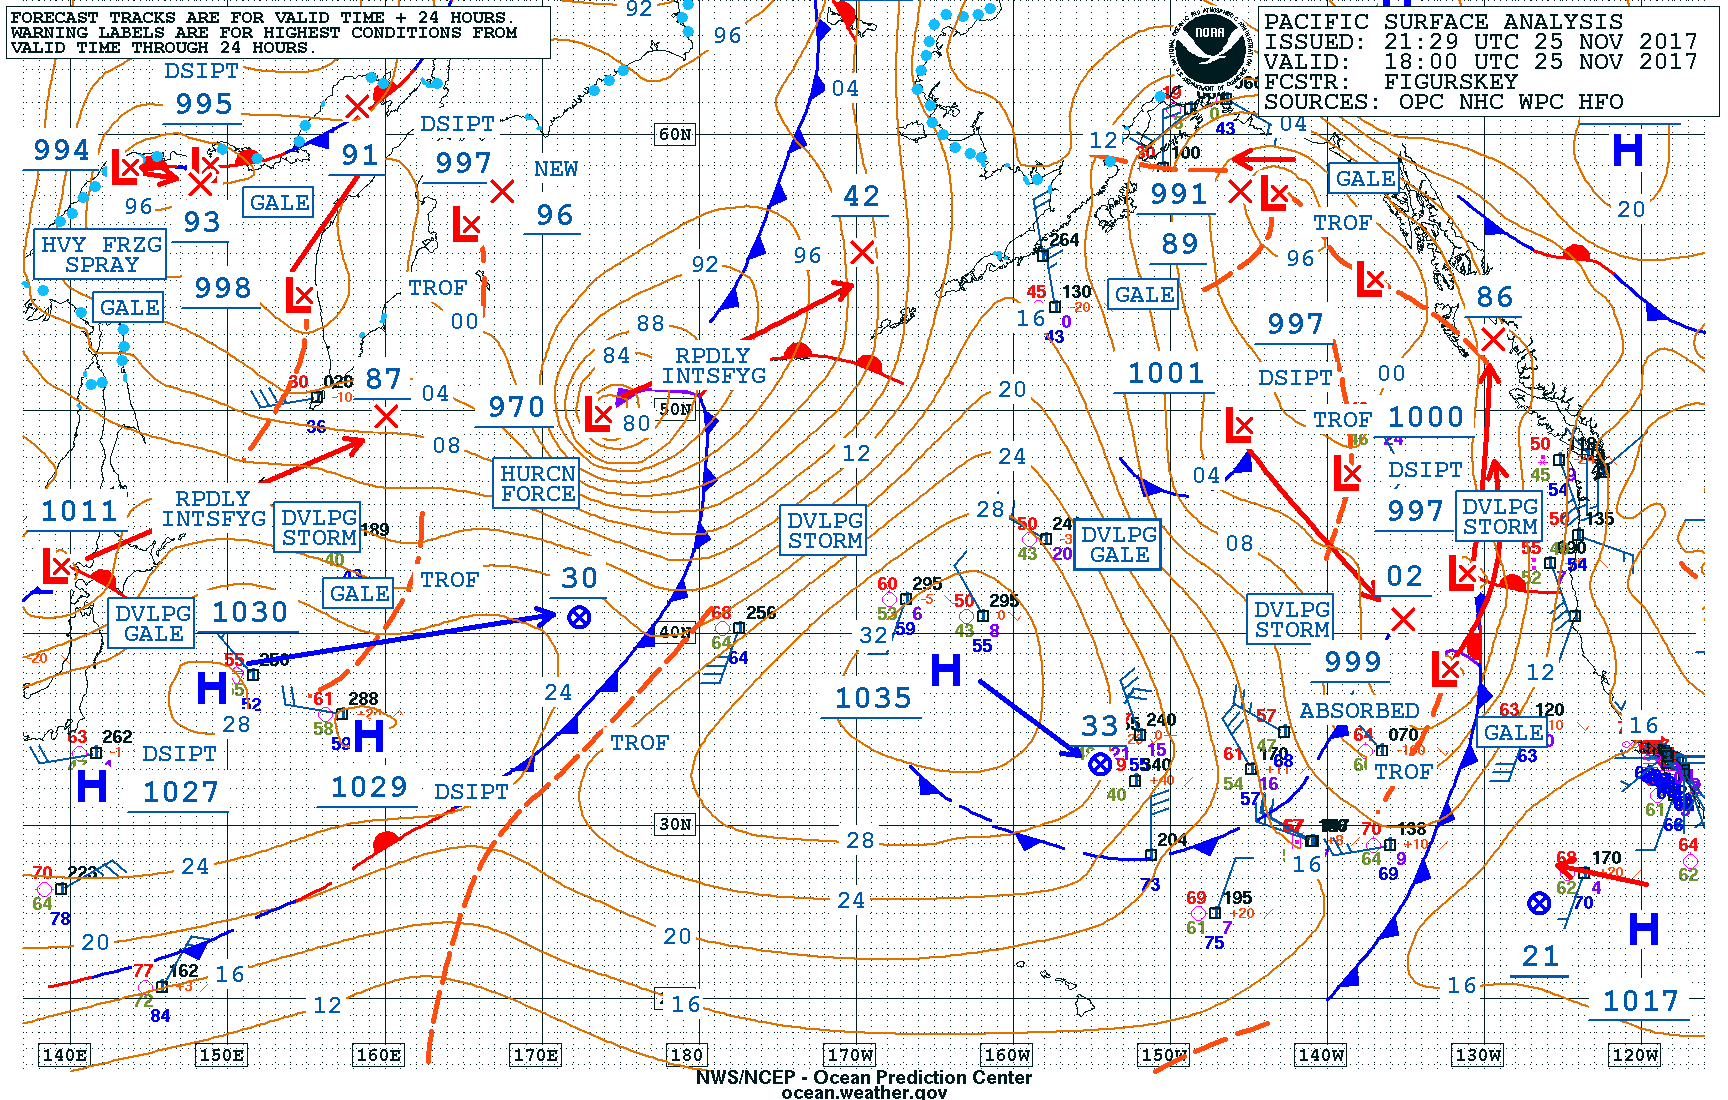
Strong storm in the Bering Sea
![Himawari-8 Lower-level (7.3 µm, left), Mid-level (6.9 µm, center) and Upper-level (6.2 µm, right) Water Vapor images, with hourly surface wind gusts (knots) plotted in red [click to play MP4 animation]](https://cimss.ssec.wisc.edu/satellite-blog/wp-content/uploads/sites/5/2017/11/HIM08_WATER_VAPOR_26NOV2017_EXP_960x427_B1098_2017330_070000_0003PANELS_00060.GIF)
Himawari-8 Lower-level (7.3 µm, left), Mid-level (6.9 µm, center) and Upper-level (6.2 µm, right) Water Vapor images, with hourly surface wind gusts (knots) plotted in red [click to play MP4 animation]
GOES-15 (GOES-West) Visible (0.63 µm) images during the daylight hours of 25 and 26 November (below) offered a more detailed view of the storm. As with the water vapor images above, hourly surface wind gusts (knots) are plotted in red on the images.
![GOES-15 Visible (0.63 µm) images, with hourly surface wind gusts (knots) plotted in red [click to play animation]](https://cimss.ssec.wisc.edu/satellite-blog/wp-content/uploads/sites/5/2017/11/171125-26_goes15_visible_wind_gusts_Bering_Sea_anim.gif)
GOES-15 Visible (0.63 µm) images, with hourly surface wind gusts (knots) plotted in red [click to play animation]
![Time series of surface observations for Adak, Alaska [click to enlarge]](https://cimss.ssec.wisc.edu/satellite-blog/wp-content/uploads/sites/5/2017/11/171125-26_PADK_SFCMG.GIF)
Time series of surface observations for Adak, Alaska [click to enlarge]
Aqua and Terra MODIS satellite imagery of #hurricane force low that has lashed the Bering Sea and Aleutian Islands for the past 36 hours. Buoy 46075 (pink star) measured phenomenal seas for several hours (circled), with significant wave heights peaking at 52.2 ft (15.9 m) #akwx pic.twitter.com/uYcdXkdkWN
— NWS OPC (@NWSOPC) November 27, 2017
Also of note: the surface pressure at St. Paul Island dropped to unusually low levels as the storm moved into the Bering Sea.
![Time series of surface observations from St. Paul Island [click to enlarge]](https://cimss.ssec.wisc.edu/satellite-blog/wp-content/uploads/sites/5/2017/11/171125-26_PASN_SFCMG.GIF)
Time series of surface observations from St. Paul Island [click to enlarge]
This morning’s altimeter pressure setting of 27.95″ at St. Paul Island, Alaska, is the 3rd lowest since 1949 at that station. [27.67 on Oct 25, 1977 & 27.82″ on Dec 26, 1973]. @AlaskaWx
— Brian Brettschneider (@Climatologist49) November 26, 2017