
AVIRIS SCAR-B scene. Note cloudy and vegetated areas used to compute Rcloud and Rveg.
Back
Click on a GOES series satellite to view the GOES Imager Visible SRF.
To quantitativly depict the differences of each GOES instrument in the visible region, a GOES visible SRF was convolved with the AVIRIS SCAR-B scene. From each new convolved AVIRIS file the same section of cloud and vegetation were used to create an 'average' radiance for each GOES visible SRF. Below the table is an image showing the cloud and vegetated areas used to compute Rcloud and Rveg.
| GOES | Rcloud | Rveg | Delta R | Delta Rabi - Delta Rgoes |
|---|---|---|---|---|
| 8 | 34.111 | 3.367 | 30.744 | 1.464 |
| 9 | 33.921 | 3.181 | 30.740 | 1.468 |
| 10 | 33.314 | 3.303 | 30.011 | 2.197 |
| 11 | 32.955 | 3.422 | 29.533 | 2.675 |
| 12 | 33.322 | 3.298 | 30.024 | 2.184 |
| ABI | 34.335 | 2.127 | 32.308 | - |
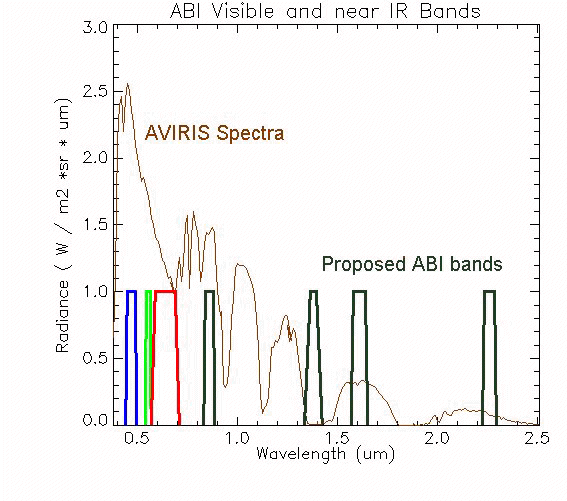
Note the largest difference between current GOES visible bands and proposed ABI visible band lies between the GOES-8 and GOES-11 (~1 W/m2 * sr * um). View a plot with all ABI bands including the 0.64um band (indicated in red).