The purpose of this web page is to illustrate the difference between ABI
and MODIS visible and near IR channels. AVIRIS data from the SCAR-B
field experiment was used to simulate the ABI and MODIS channels using
the respective spectral response functions (SRFs). For these differences to have meaning there must be
a reference point for comparison. Below is a spectral plot of a clear and cloudy
scene over the SCAR-B scene. Notice radiance values going between a clear sky and
a cloudy sky can differ as much as eight watts. Refer to this image when attempting
to deduce the signficance of the following difference images.
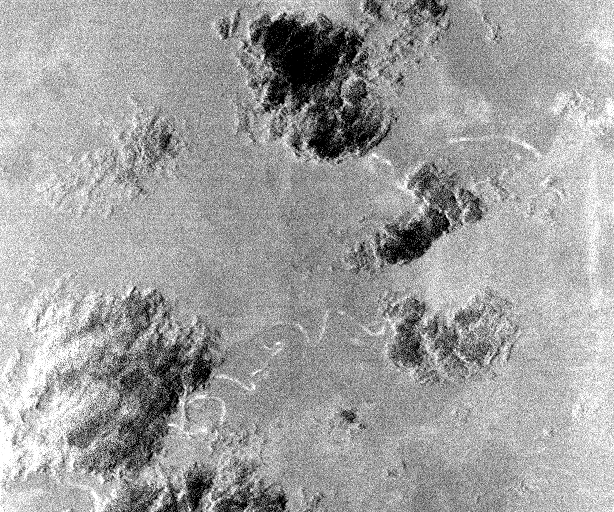
Above: ABI 0.48um - MODIS 0.48um Difference Image. See below for
difference image histogram.
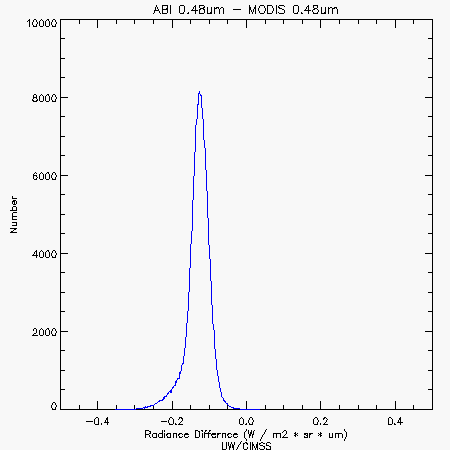
Above: ABI 0.48um - MODIS 0.48um difference image histogram. Notice how
the difference between ABI and MODIS is quite small.
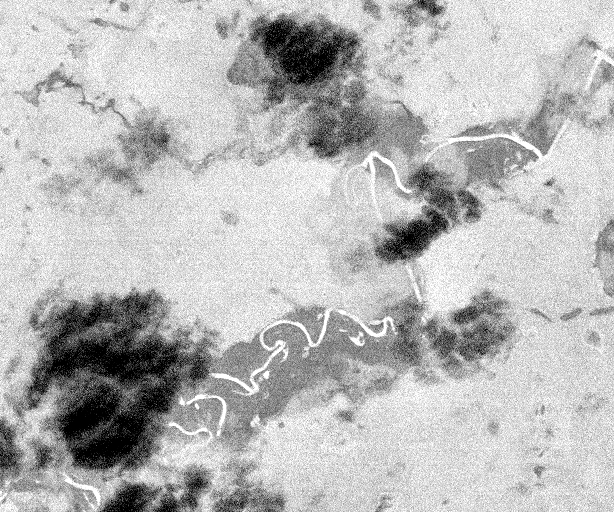
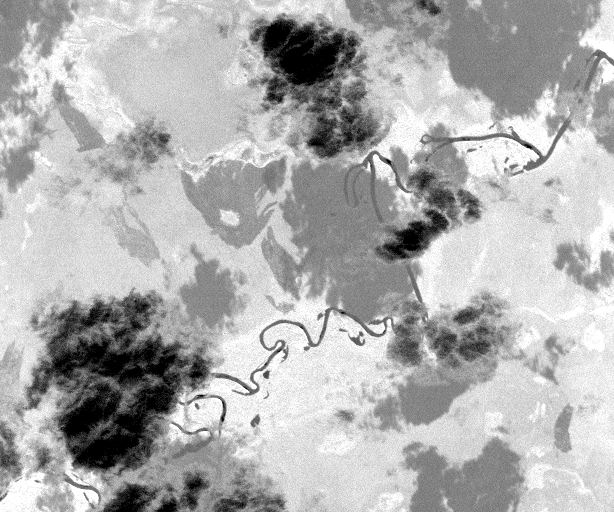
Above: ABI 0.555um - MODIS 0.555um Difference Image. See below for
difference image histogram.
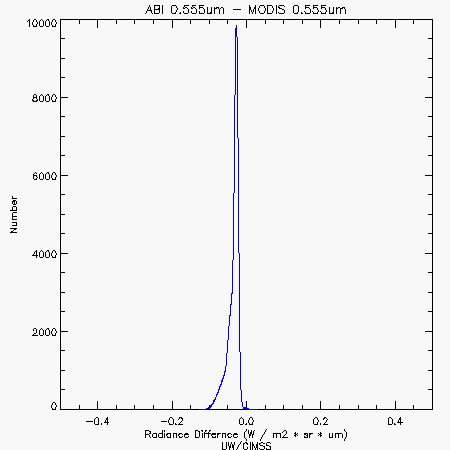
Above: ABI 0.555um - MODIS 0.555um difference image histogram. Notice how
the difference between ABI and MODIS is quite small.
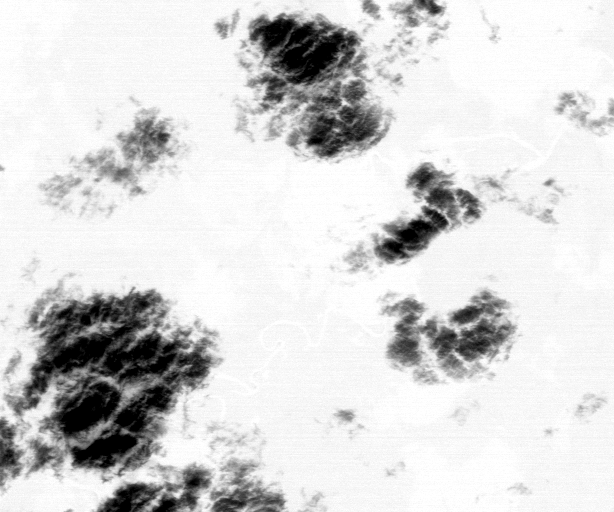
Above: ABI 0.86um - MODIS 0.86um Difference Image. See below for
difference image histogram.
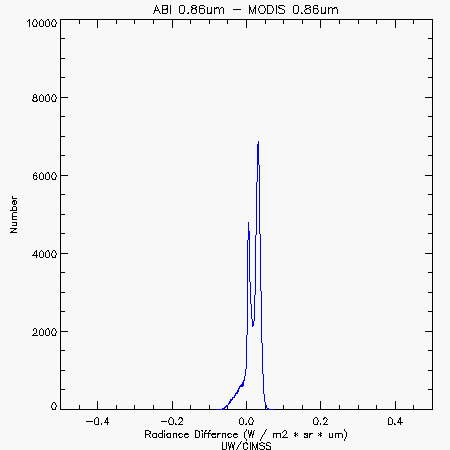
Above: ABI 0.86um - MODIS 0.86um difference image histogram. Notice how
the difference between ABI and MODIS is quite small.
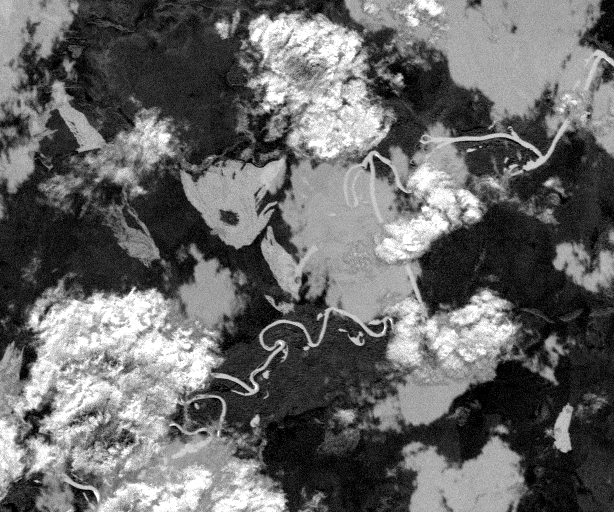
Above: ABI 1.38um - MODIS 1.375um Difference Image. See below for
difference image histogram.
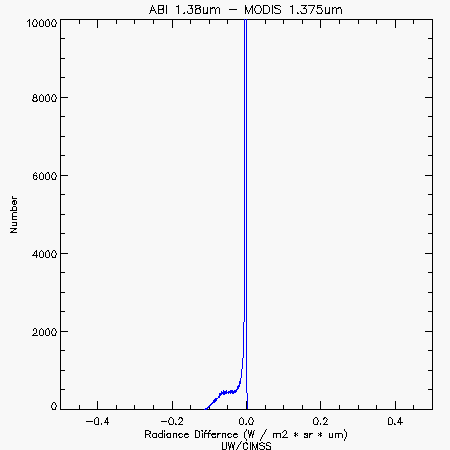
Above: ABI 1.38um - MODIS 1.375um difference image histogram. Notice how
the difference between ABI and MODIS is quite small.
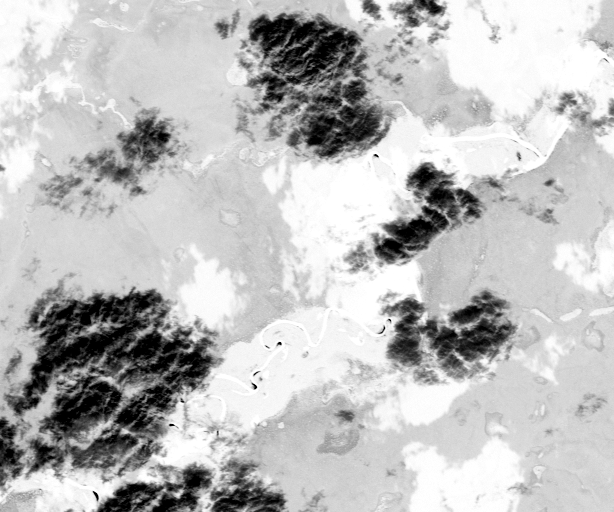
Above: ABI 1.61um - MODIS 1.64um Difference Image. See below for
difference image histogram.
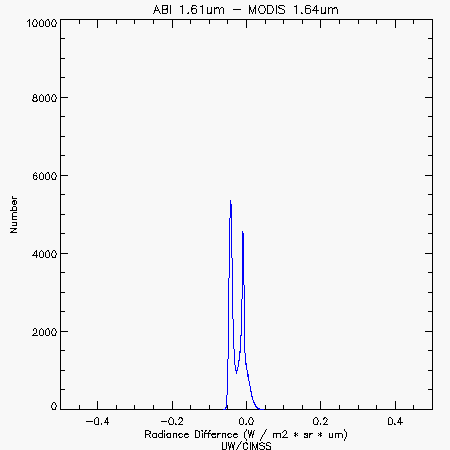
Above: ABI 1.61um - MODIS 1.64um difference image histogram. Notice how
the difference between ABI and MODIS is quite small.
Above: ABI 2.21um - MODIS 2.13um Difference Image. See below for
difference image histogram.
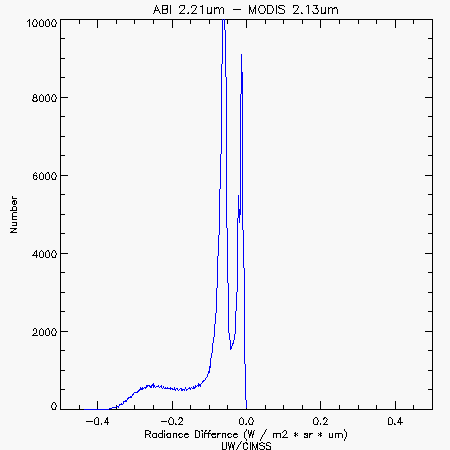
Above: ABI 2.21um - MODIS 2.13um difference image histogram. Notice how
the difference between ABI and MODIS is quite small.