The following are links pertaining to simulated ABI images. These images were simulated by first running high-spatial resolution numerical models, followed by advanced forward models. Most of these simulations were preformed on the 'cobalt' supercomputer at the National Center for Supercomputing Applications at the University of Illinois. They are provided to help prepare for the ABI data. Please credit: UW/CIMSS.
Link to AWIPS Weather Event Simulator (WES) guide: PDFCONUS case
Java (images from AWIPS): Loop of all bandsMcIDAS area files (2 km): CIMSSP3/SABI_CONUS.ALL (RETS3.SSEC.WISC.EDU) Sample Listing
NetCDF (1 and 2 km): ftp
Katrina case
Java (images from McIDAS-V): Loop of all bandsMcIDAS area files (2 km): CIMSSP3/SABI_KAT.ALL (RETS3.SSEC.WISC.EDU) Sample Listing
NetCDF (1 and 2 km): ftp
To save a png file, stop the java loop and hit the 'show' button.
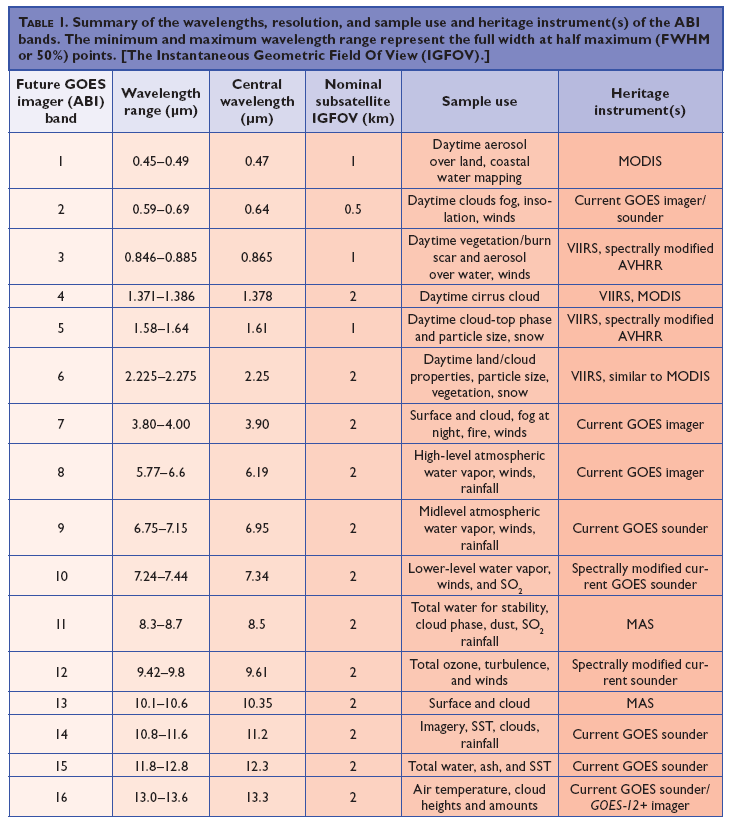
A table of the ABI bands can be found here.
Thanks to the AWG Proxy and Imagery Teams and CIMSS and others.
Near real-time ABI IR bands are simulated from the NSSL WRF model.
For questions about the data, or info on an AWIPS WES case, contact Tim Schmit.