

Steve Warren
Ryan Eastman and I have computed correlations of local cloud anomalies to global cloud anomalies, as you requested. Since we are using the same surface visual observations that Joel Norris is using, we won't repeat here what he found. We have done some analyses different from his. We did the correlations for total cloud cover and for 9 cloud types, land and ocean separately, for each of 4 seasons separately. We did the correlations both with and without prior de-trending. We correlated the land anomalies both with global land and with global land+ocean, and correlated ocean anomalies both with global ocean and with global land+ocean.
We recommend correlating like with like; e.g. correlate land anomalies with global land rather than with global land+ocean; we get higher correlations that way. We also prefer correlating the detrended anomalies so that the trend does not dominate the patterns. A few of the more striking patterns are described here, and those maps are attached.
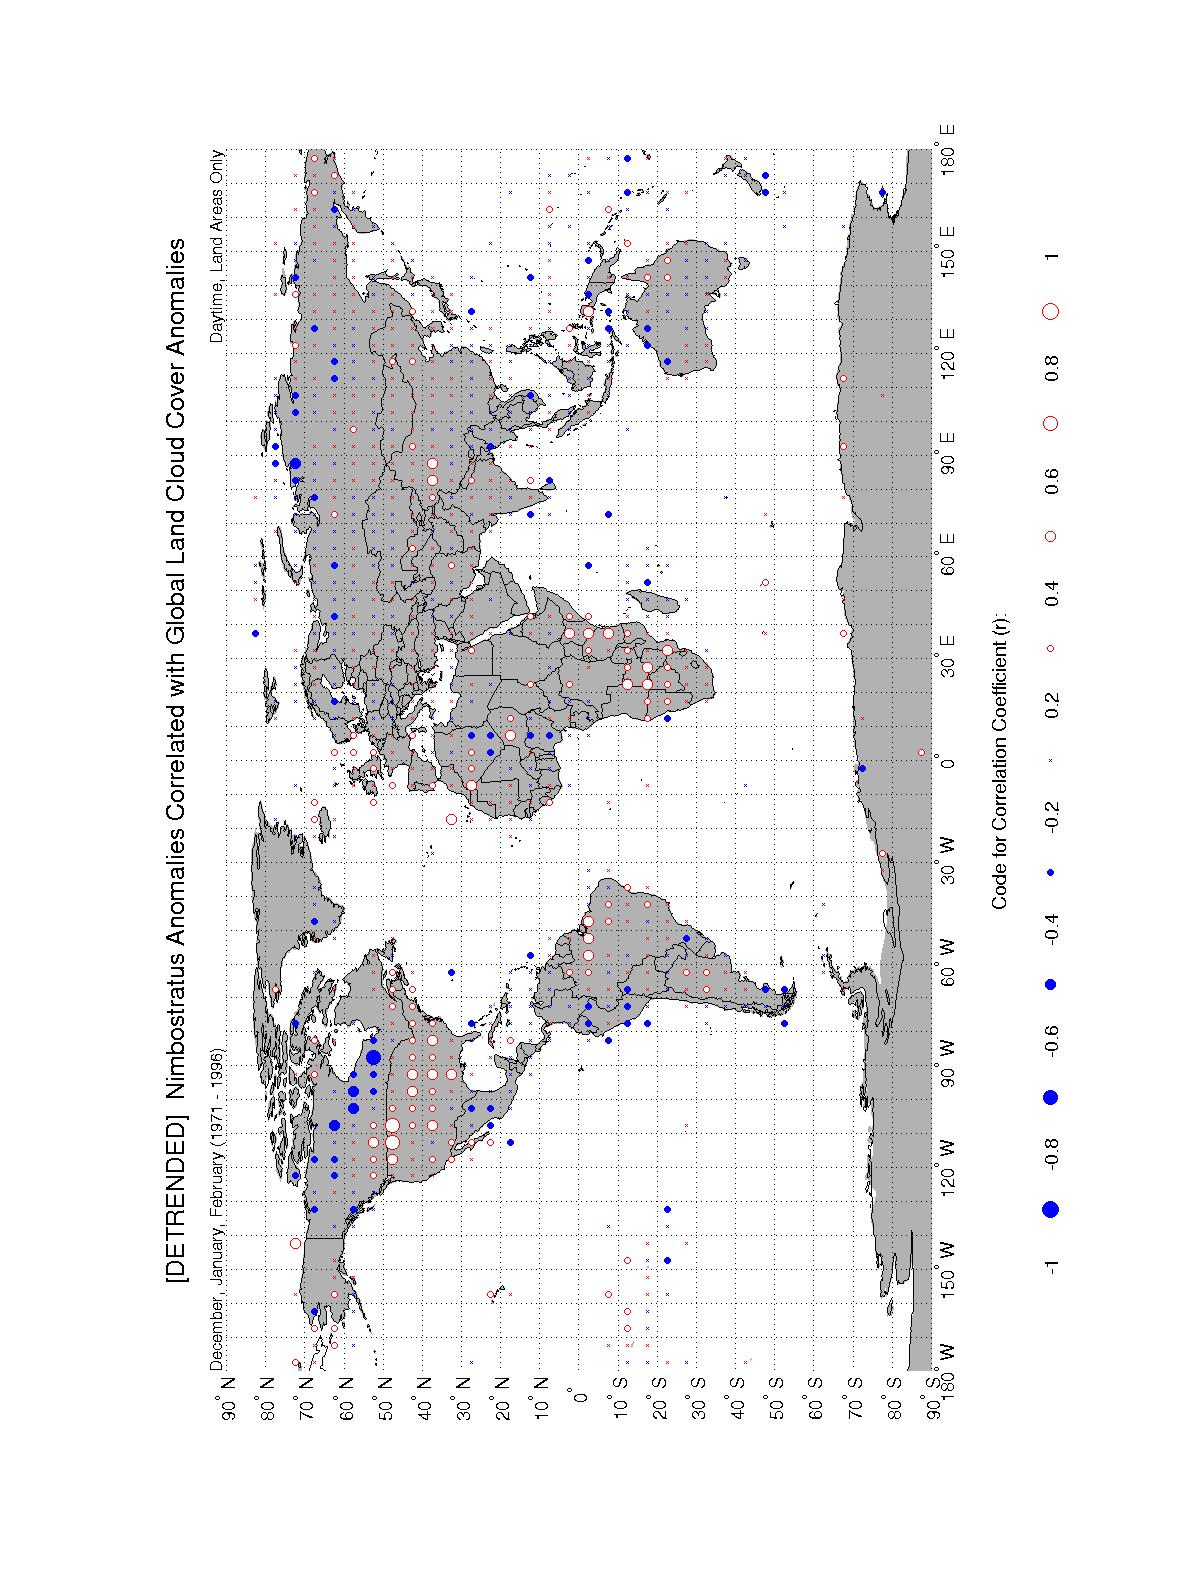
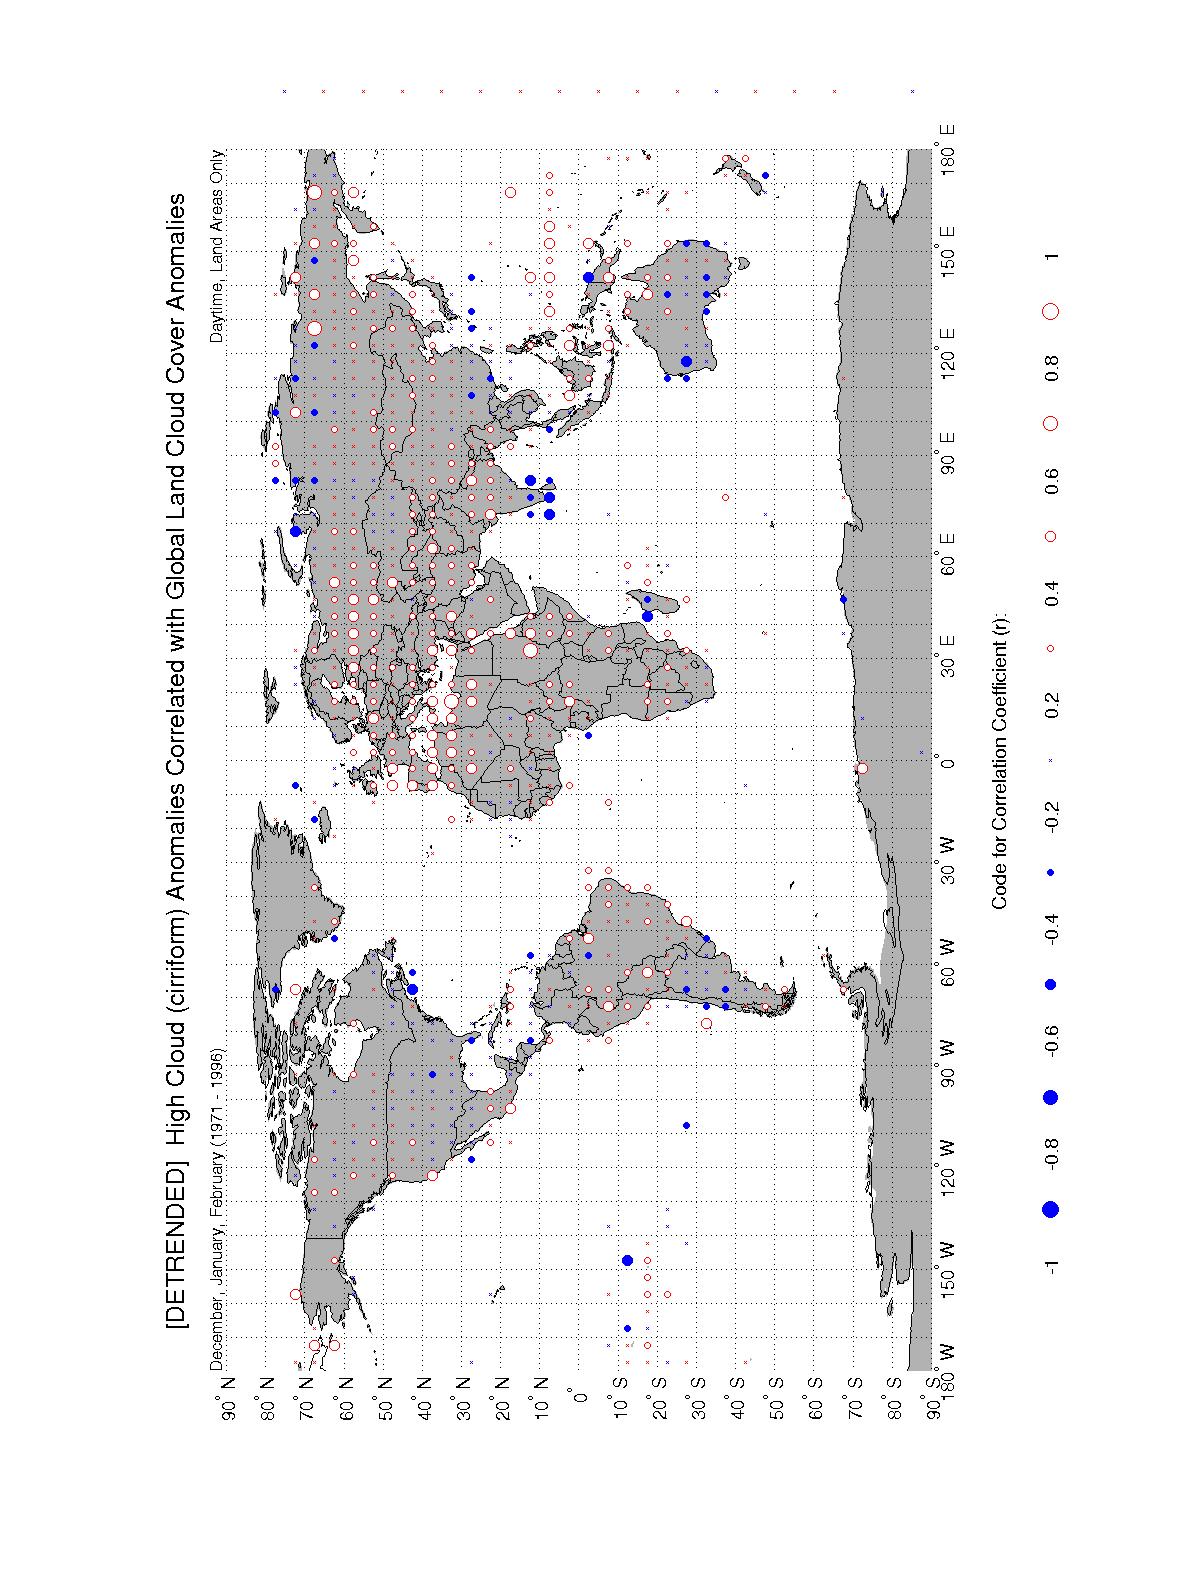
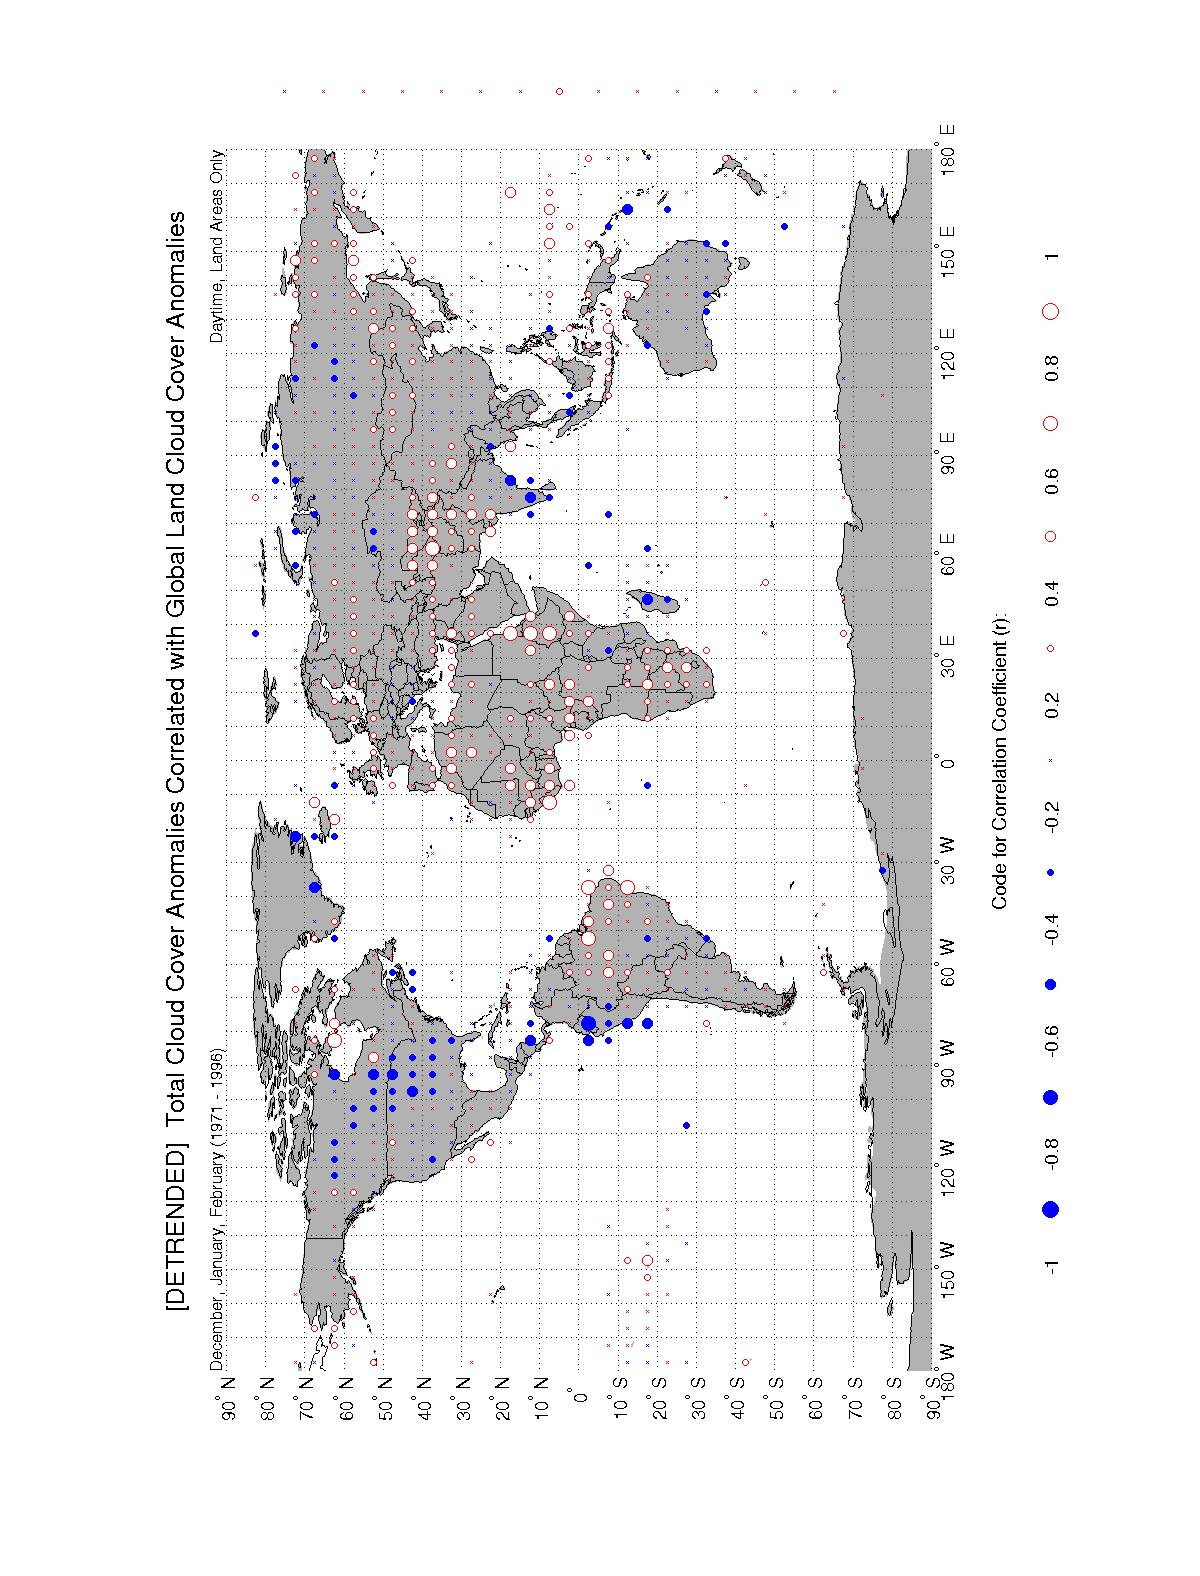
For land, we get the best correlations in the DJF season. For cirrus, Europe and Mediterranean show strong positive correlation. For nimbostratus there is positive correlation in the U.S., negative correlation in Canada. For total cloud cover there is negative correlation in North America, western South America, and southern India; positive correlation in eastern South America, Africa, and Central Asia.
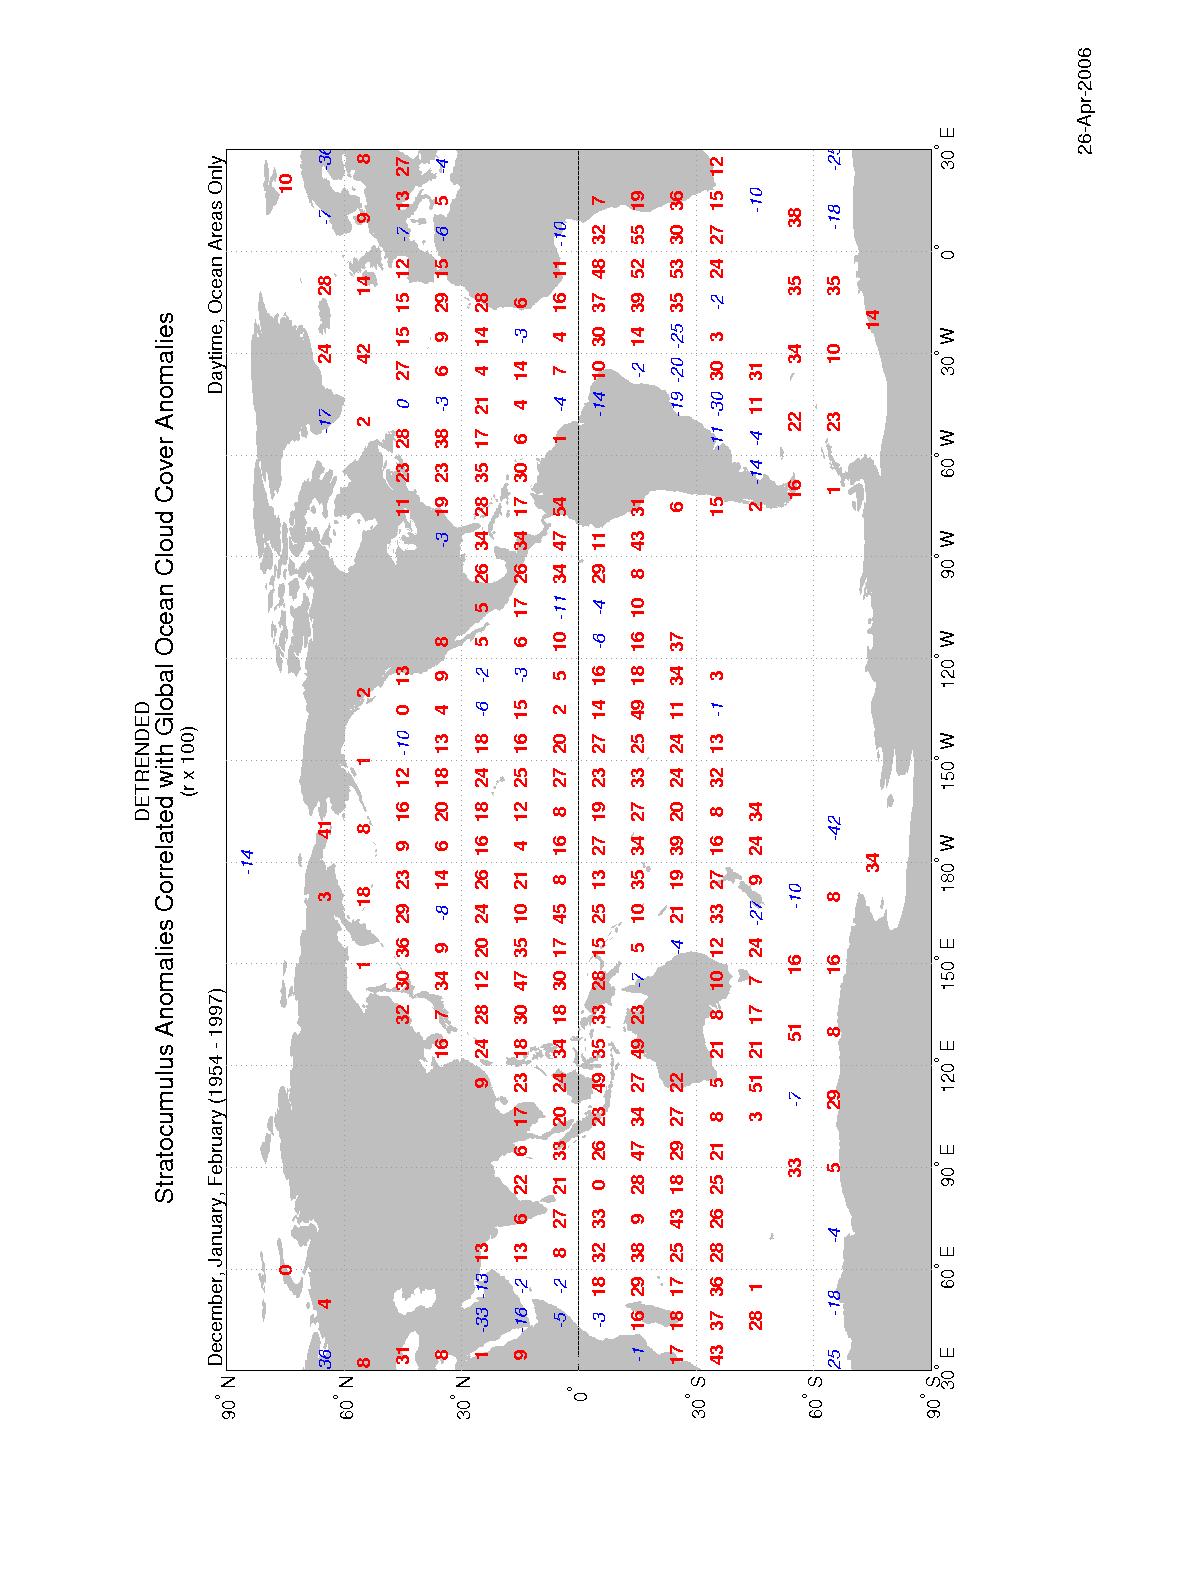
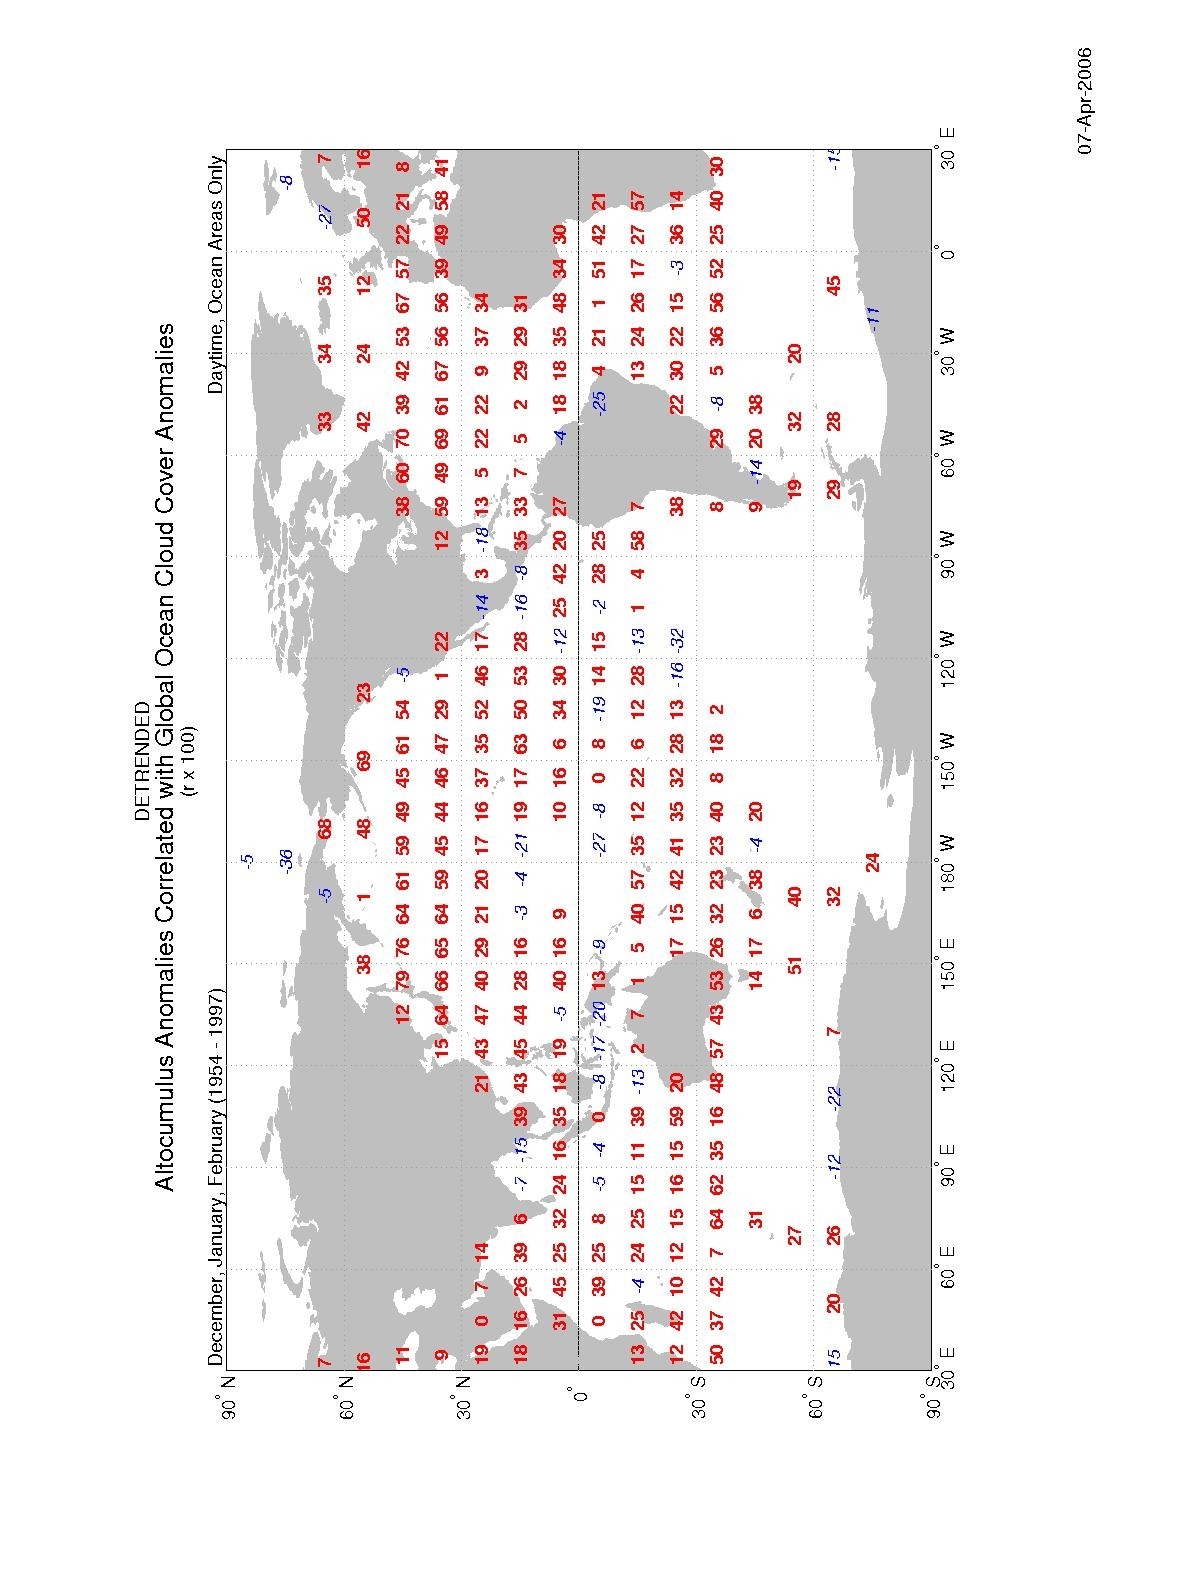
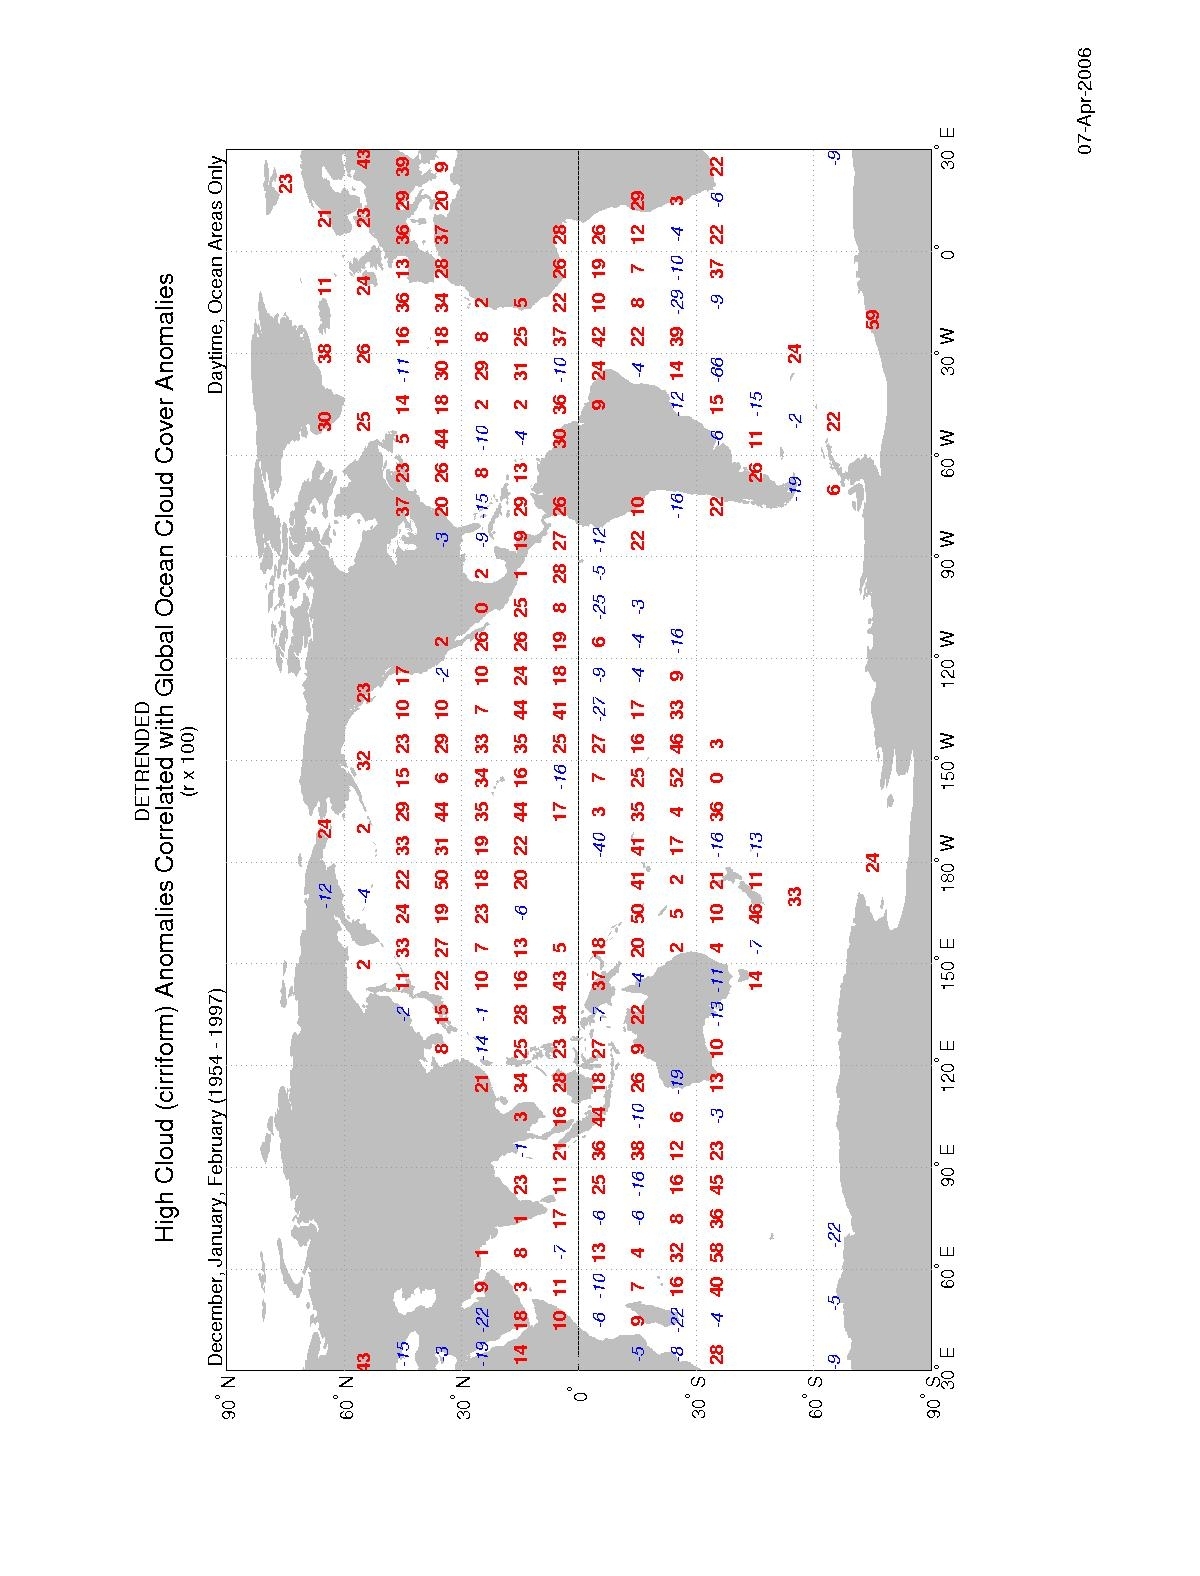
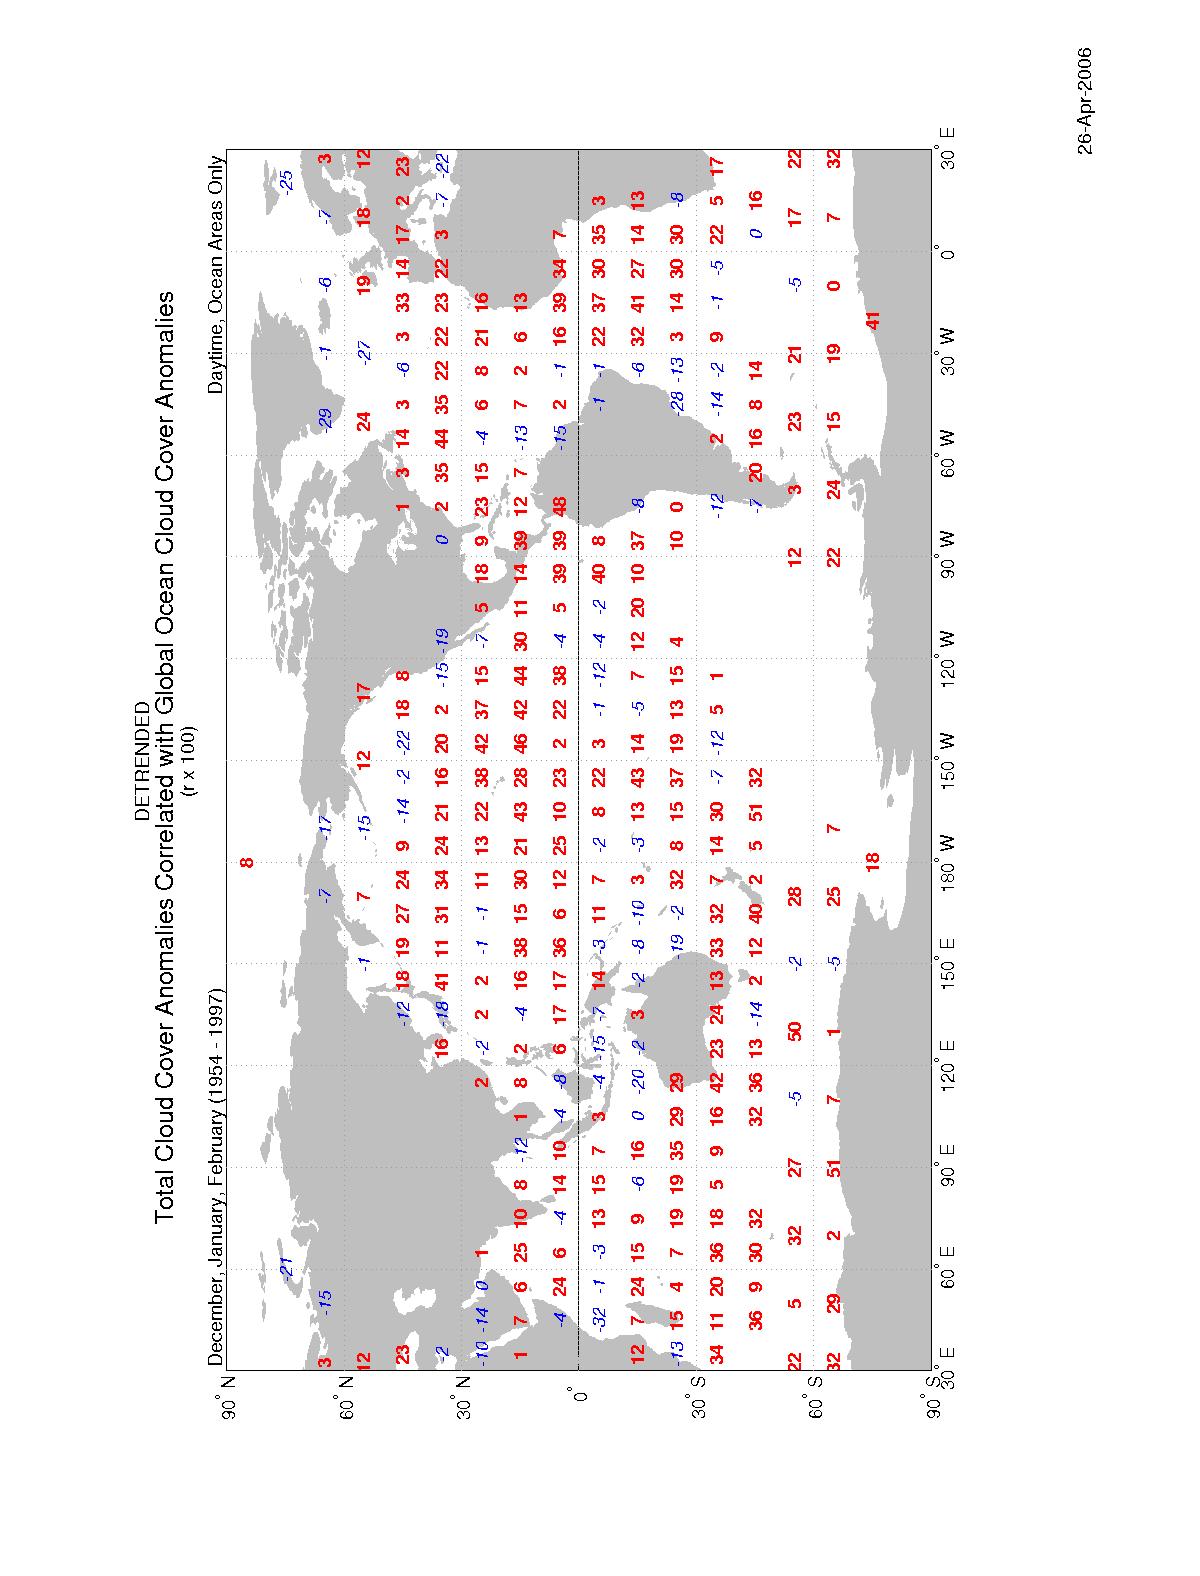
For ocean, total cloud cover is positively correlated with the detrended global ocean anomalies almost everywhere. We show the DJF season, where there is negative correlation in the western Pacific. This negative correlation is also found in MAM and JJA, presumably linked to ENSO. Stratocumulus, altocumulus, and cirrus are positive almost everywhere; their DJF maps are attached.
There are lots of maps Ryan can send you, if you want to see them, but these few seemed to be the most interesting.
Images
Land
- Nimbostratus anomalies correlated with global land cloud cover anomalies
- High cloud (cirriform) anomalies correlated with global land cloud cover anomalies
- Total cloud cover anomalies correlated with global land cloud cover anomalies
Ocean
- Stratocumulus anomalies correlated with global ocean cloud cover anomalies
- Altocumulus anomalies correlated with global ocean cloud cover anomalies
- High cloud (cirriform) anomalies correlated with global ocean cloud cover anomalies
- Total cloud cover anomalies correlated with global ocean cloud cover anomalies