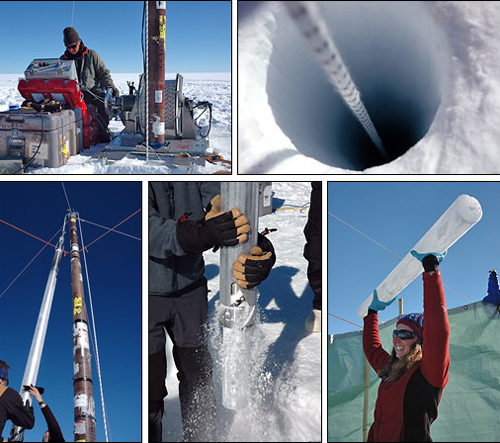
Ice Cores
Bubbles of air trapped in ice provide windows to the past for chemists and climatologists. These trapped bubbles provide a record of the concentration of atmospheric gases such as carbon dioxide( CO2) and methane( CH4 ) over the past several hundred thousand years.
Other climate clues found in ice cores and glaciers include dust from volcanoes or storms and soil from erosion.
Records reach back about 750,000 years from Antarctica ice cores, however, these photos are from NASA drilling projects on Greenland in 2005.
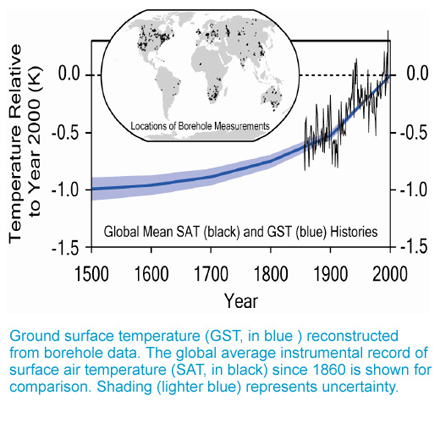
Borehole data
Borehole data is direct measurements of temperature from boreholes drilled into the Earth crust. Departures from the expected increase in temperature with depth (the geothermal gradient) can be interpreted in terms of changes in temperature at the surface in the past.
This graph depicts temperatures reconstructed from 800 borehole sites on six continents and an average temperature increase over the past five centuries of about 1 Celsius degree, half of which occurred in the 20th century. The 20th century data is similar to warming observed and recorded by meteorological stations since 1860.
(from Pollock 2005)
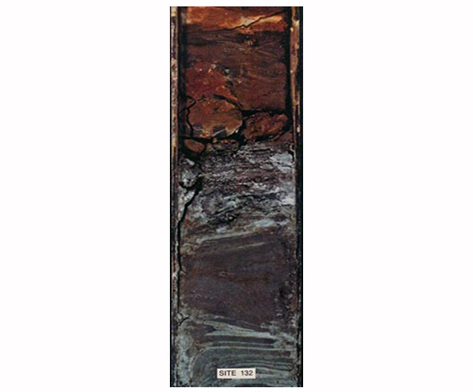
Marine Sediments
Materials have been layered onto the ocean floor for millions of years. The deeper the layer, the older the sediments. Layers can include soil from wind erosion or floods, ash from volcanic eruptions, and shells of animals.
Ocean animal shells are primarily calcium carbonate (CaCO3) which is extremely useful for tracking past climates by the relative amounts of oxygen atoms with different atomic weights, or isotope ratio. The oxygen isotope ratio in the shells of marine animals provides information about surface air temperatures.
Sediment cores from the ocean floor provide an indirect record of climate as far back as 3 million years!
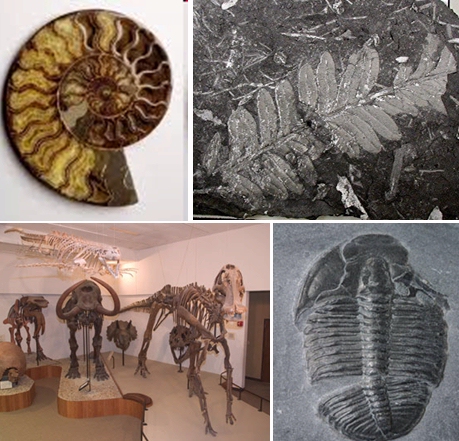
Fossil Records
Fossils reveal ancient animal and plant life that can be used to infer climate characteristics of the past. They provide a means to track life through the ages because they are an integral part of the rocks in which they are formed. The age of the rocks can be dated by radiometric dating techniques, providing evidence for climate extending back hundreds of millions of years.
The fossils included in this 4 panel image include an ammonite, a fern, the dinosaur display from the UW-Madison Geology Museum and a trilobite.
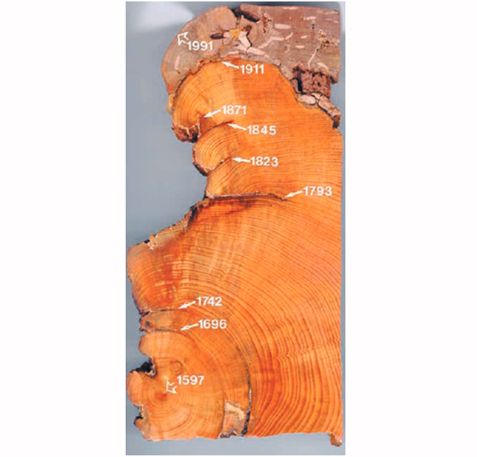
Tree Rings
Climatic conditions and weather variations influence tree growth. The diameter of a tree trunk increases as the tree grows, typically adding one concentric ring each year. The width of these rings indicates how fast the tree grew during a particular period and is a function of moisture, temperature and solar radiation. For example, scientists can relate tree ring width to modern-day precipitation and estimate precipitation amounts for years prior to when weather observations were available.
The science of studying tree rings to ascertain a climatic condition
is known as dendrochronology.
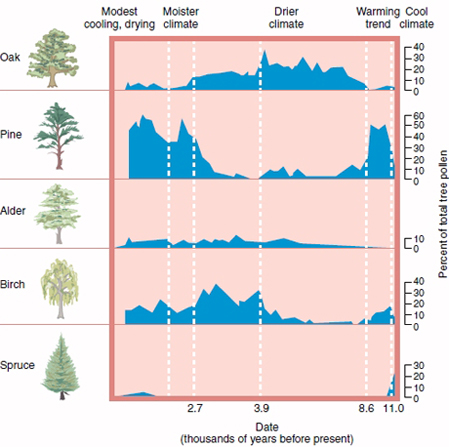
Pollen Records
In addition to growth rings, trees produce pollen that can accumulate in a given area, such as a lake. Pollen degrades slowly and each species of pollen has a distinctive shape identifiable under a microscope. Although pollen grains do not give the same detailed year-to-year information that tree rings do, they are valuable in extending our understanding of climate back tens of thousands of years by radiocarbon dating.
The pollen samples used to construct the diagram in this image come from a bog in northern Minnesota and provide climate clues for the past 11,000 years. Note the five periods denoted at the top of the figure bounded by the vertical dashed white lines. To learn more about this pollen record click on the speaker and listen to the audio file.