Probability and Uncertaintity
Probability refers to the likelihood of occurrence of a specific event.
Communication of uncertainty information in IPCC assessments has evolved through successive reports to provide increasingly formal and less subjective classifications. The 2015 IPCC assessment (AR5) uses probabilistic ranges to avoid ambiguity by expressing likelihoods of events occurring.
The methodology of IPCC AR5 gives uncertainties spanning zero to 100 percent probability.
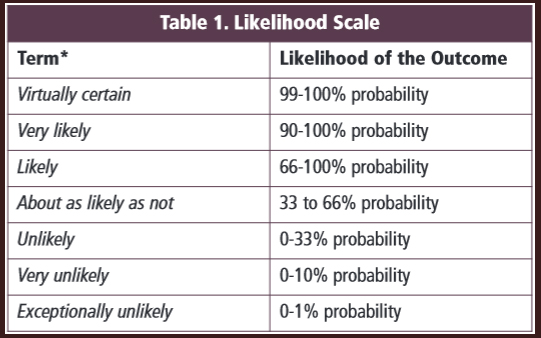
Likelihood Scale
For the quantitative assessments, most often used in the scientific disciplines, the IPCC uses a Likelihood Scale to consistently define the probability, or likelihood of occurrence.
The Likelihood Scale is based on statistics and probability. Statistics is the language that scientists use to objectively and consistently make conclusions about data. However, statistics is not always the best way to communicate findings to a broad audience for the purpose of making new policies or educating the public. By using the Likelihood Scale, the IPCC can effectively communicate what we know and what we don't know about global climate change.
SPM Table 1
Below is an example of how the IPCC uses the likelihood scale in the 2013 Summary for Policy Makers report. Table 1 shows recent trends, assessment of human influence on the trend and projections for extreme weatherevents for which there is an observed late-20th century trend.
Note the strong connection between human activities and rising global temperatures since 1960.
Rather than sharing these trends and probabilities in numerical percentages, the IPCC conveys the information using the likelihood scale.

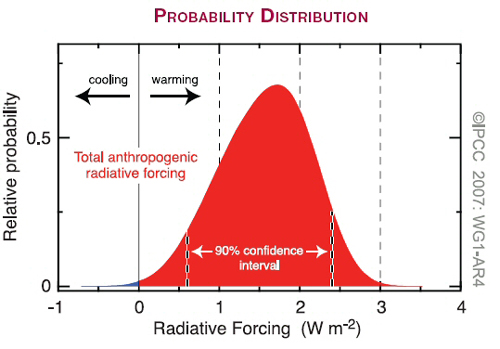
Confidence Intervals
Confidence intervals provide more information than point estimates. Confidence intervals for means are intervals constructed using a procedure that will contain the population mean a specified proportion of the time, typically either 90%, 95% or 99% of the time. When you compute a confidence interval, you compute the mean of a sample in order to estimate the mean of the real population. (if you already knew the real population mean, there would be no need for a confidence interval)
PPM vrs PPB
It is important to remember that climate scientists use one unit when measuring carbon dioxide levels and a different unit when monitoring methane and nitrous oxide.
Carbon dioxide (CO2) is measured and reported in parts per million by volume (ppm), or one part in 1 million.
Methane (CH4) and nitrous oxide (NO2) are measured and reported in parts per billion by volume (ppb) or one part in 1 billion.
Obviously 1 ppb is a much smaller concentration.
Below is an example graph, from the IPCC Frequently Asked Questions publication where two different units are plotted on one graph. At first glance the plots look similar but CO2 is much more abundant in our atmosphere, by a factor of ten (or more!)

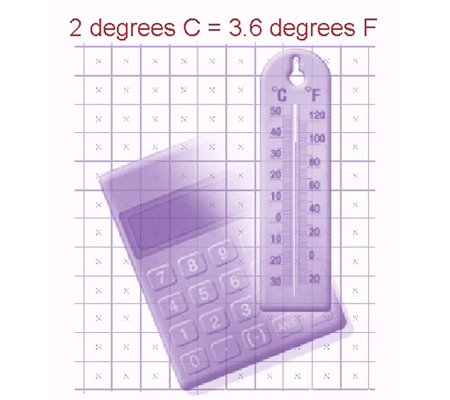
The metric system
Not surprisingly, the IPCC uses the metric system to quantify climate change, conveying temperatures in degrees Celcius, sea level measurements and projections in millimeters, solar radiation (or insolation) in watts per square meter and carbon sinks and sources in gigatons carbon(GtC).
;
In 2009, eight industrialized countries (the G-8), agreed on a target for curbing rising global temperatures to no more than 2 degrees Celsius above pre-industrial levels, or 3.6 degrees Fahrenheit.
If warming exceeds 4 degrees Fahrenheit, scientists and economists predict that the consequences of negative impacts related to climate chnage are likely to be much greater than any possible positive impacts.